When diving into data science, one common question is, “Which tool should I start with?” The endless options can feel overwhelming. Among these choices, R stands out as a go-to for many data professionals.
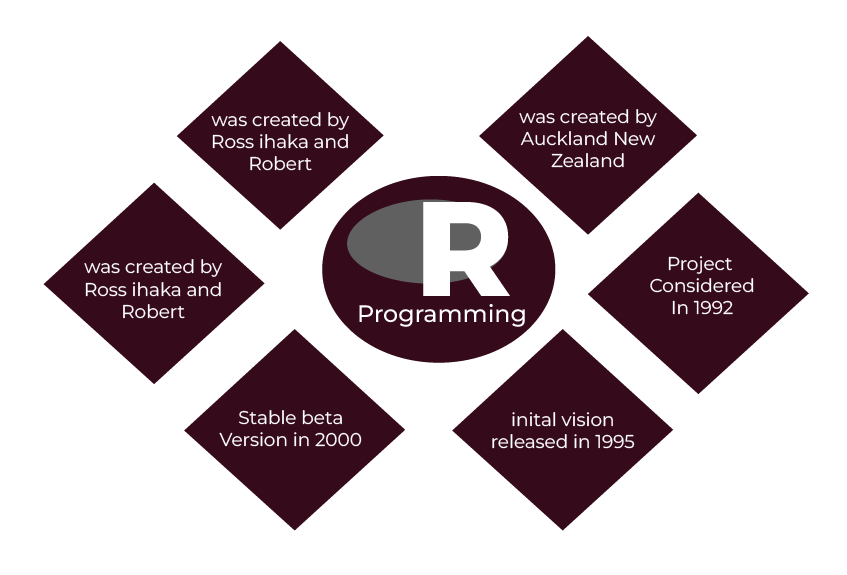
Developed in the 1990s, it has now become the backbone of data analysis in fields ranging from healthcare to finance. R is not about crunching numbers but about converting raw data into meaningful stories.
R programming for data science is more than just a programming language. It is a powerful tool exactly designed for statistical computing and visualisation, holding the ability to transform raw numbers into meaningful insights while analyzing complex datasets, building predictive models, or developing visual narratives.
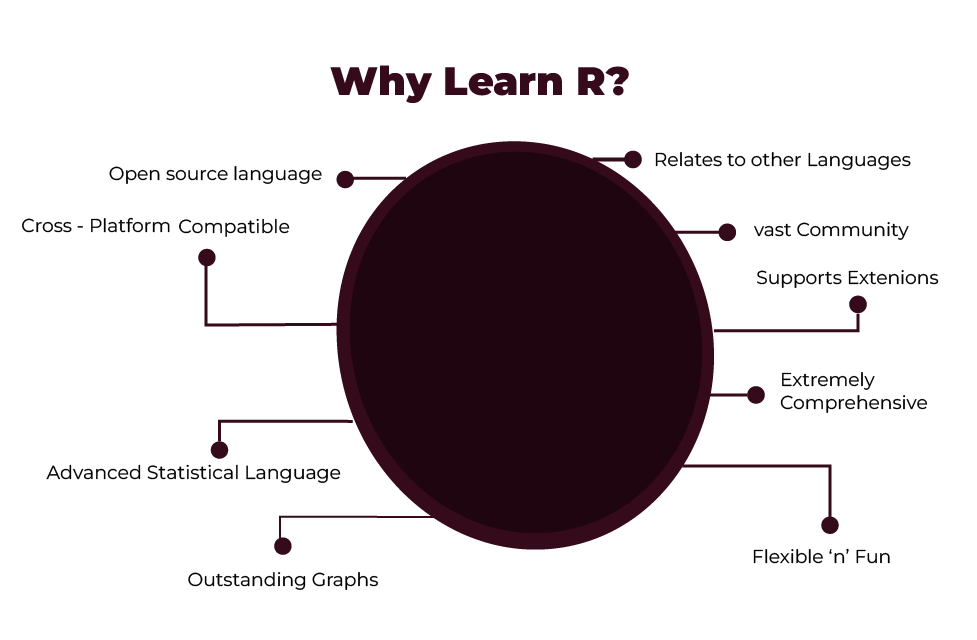
A notable characteristic of this software is its open-source nature, which signifies that it is available for free and develops through contributions from the community. It functions effortlessly on Windows, Mac, and Linux platforms, thereby ensuring accessibility for all users. Whether one is analysing trends in public health or developing intricate financial models, R programming for data science offers the essential tools required to conduct in-depth data analysis.
The best part? It’s created by statisticians and data scientists. Libraries and packages make things as simple as possible, but no simpler; if we want to clean messy datasets, make insightful visualisations, or build predictive models, R’s there for us.

The Key Features That Make R Programming for Data Science Indispensable
R isn’t just popular; it’s powerful. Here’s why professionals across industries rely on it.
- Free and Open Source
R is completely free to download and use. Its open-source nature allows developers worldwide to contribute, ensuring it’s always improving and expanding.
- Built for Statistical Computing
From basic statistical summaries to advanced analyses, R excels at everything. It comes with built-in functions for regression, clustering, and time-series analysis.
- Superior Data Visualisation
R’s libraries, like ggplot2, can produce beautiful plots and charts. Be it a bar plot, heat map, or any form of interactive visualisation, R enables that too.
- Cross-Platform Compatibility
R operates on all the significant platforms. We can start a project from a Windows machine, share it with a colleague working on Mac, and then deploy the same on Linux without any problem.
- Community Support
R has an enormous user and contributor base. If we are stuck somewhere, forums, tutorials, and online courses will solve our problems and give us step-by-step guidance.
- Integration with Other Tools
R integrates very well with all the tools, including Python, SQL, and Hadoop. This makes it an all-rounder in creating workflows that combine pieces of different technologies.


Get curriculum highlights, career paths, industry insights and accelerate your technology journey.
Download brochure
Getting Started with R Programming for Data Science: Essential Setup and First Steps
Starting with R programming for data science is easy, even if you are a beginner. Here’s how we can get going.
- Installing R and RStudio
The first step is downloading R from CRAN. To make our work easier, we should also install RStudio, a popular Integrated Development Environment (IDE) for R. RStudio simplifies coding with its intuitive interface.
- Exploring RStudio
Once installed, we’ll notice four main panes in RStudio:
- Console: Where we execute our commands.
- Environment: Tracks the data and variables we’re working with.
- Script Editor: For writing and saving scripts.
- Plots/Files: Displays visual outputs and file navigation.
- Writing Our First Script
Let’s start small. Here’s a simple R script:
# Adding two numbers
x <- 5
y <- 10
sum <- x + y
print(sum)
Running this script in RStudio’s console gives us the result instantly.
- Using Built-in Datasets
R programming for data science comes with datasets like mtcars and iris.
For example, the mtcars dataset gives us insight into cars’ mileage, horsepower, and more, perfect for practice.
Both R and Python are top contenders in data science, but they shine in different areas. Here’s how they compare.
| Feature |
R |
Python |
| Focus |
Best for statistical analysis and data visualisation |
General-purpose, versatile for various applications |
| Learning Curve |
Easier for those with a statistics background |
Intuitive for beginners in programming |
| Community |
Strong focus on data science and statistics |
Broader, including web and software development |
| Data Visualisation |
Libraries like ggplot2 excel in creating graphs |
Libraries like Matplotlib and Seaborn are effective |
| Machine Learning |
Limited but improving |
Strong support with libraries like Scikit-learn |
| Integration |
Integrates with Python, SQL, and Hadoop |
Integrates well with most tools, including R |
When to Choose R
- If our work focuses on statistical analysis and complex visualisations, R is the better choice.
- R’s syntax is tailored for statisticians, making tasks like hypothesis testing or regression models straightforward.
When to Choose Python
- For projects involving deep learning, web development, or automation, Python offers more flexibility.
- Python’s simplicity makes it ideal for beginners starting their data science journey.
An Exhaustive Guide to R Libraries and Packages for Data Science Tasks
When working with data, we often face messy datasets, complex analysis, and the need for clear visualisations. R makes this manageable with its vast collection of libraries and packages tailored for every task.
Each library has a specific role, helping us clean, transform, visualise, or model data. Let’s dive into the must-have tools that make R programming for data science so effective.
Data Wrangling and Cleaning
Data rarely comes tidily. That’s why we need robust tools to get it in shape.
| Tool/Library |
Description |
Example |
| dplyr |
Simplify data manipulation with functions for selecting, filtering, and arranging rows. |
Sorting sales data by highest revenue becomes effortless with dplyr. |
| tidyr |
Reshape messy data into a usable format. |
Split a single column of addresses into city and state easily. |
| janitor |
Clean column names and identify duplicates. |
Ideal for auditing data before deeper analysis. |
| RCrawler |
Scrape data from websites efficiently. |
Collecting pricing data for competitor analysis with minimal code. |
Also Read: Data Cleaning: Enhancing Accuracy and Reliability
Data Visualisation
When it’s time to share insights, visualisation is key.
| Tool/Library |
Description |
Example |
| ggplot2 |
Create stunning plots with this popular library. |
Plot sales trends over months using a line graph. |
| esquisse |
Drag-and-drop interface for quick visuals. |
Brings Tableau-like simplicity into R for quick plotting tasks. |
| plotly |
Add interactivity to visuals, ideal for dashboards. |
Zoom into scatter plots or filter data interactively. |
| leaflet |
Map visualisation made simple. |
Plot store locations or track delivery routes. |
Machine Learning and Statistical Analysis
R doesn’t stop at data prep and visuals—it’s a powerful tool for modelling too.
| Tool/Library |
Description |
Example |
| caret |
Train and evaluate machine learning models with ease. |
Build a regression model to predict house prices. |
| e1071 |
Use support vector machines (SVM) for classification problems. |
Ideal for spam detection or fraud analysis. |
| Mlr |
Simplify complex machine learning workflows. |
Handle tasks like classification, regression, and survival analysis seamlessly. |
| randomForest |
Build robust models with random forests. |
Perfect for handling datasets with many variables. |
Specialised Tools
Sometimes, we need specific solutions for unique challenges.
| Tool/Library |
Description |
Example |
| lubridate |
Handle date and time data without headaches. |
Extract the day of the week from a transaction timestamp. |
| stringr |
Process and clean text data. |
Great for sentiment analysis or keyword extraction. |
| shiny |
Share insights through interactive web applications. |
Build a tool where users explore data visually. |
| knitr |
Generate reports combining code, visuals, and text. |
Create seamless documentation that integrates analyses and visuals. |
| DT |
Create interactive data tables for presentations or apps. |
Display large datasets in a user-friendly and interactive way. |
Real-World Applications of R Programming for Data Science Across Industries
R programming for data science isn’t just a theoretical tool. It’s used by professionals to solve real-world problems across industries.
Healthcare
- R helps predict patient outcomes.
- Example: A model built in R could analyse patient data to estimate recovery times.
Finance
- Banks use R for fraud detection.
- Example: Tracking anomalies in thousands of transactions.
Retail
- Retailers rely on R for customer segmentation.
- Example: Analysing purchase data can reveal trends that drive personalised marketing campaigns.
Genomics
- R processes vast datasets to identify genetic markers.
- Example: Biologists use libraries like Bioconductor to study DNA sequences.
Logistics
- Delivery companies optimise routes using R.
- Example: By analysing traffic patterns and delivery times, R helps reduce costs and delays.
Also Read: Top Data Science Interview Questions and Answers
Common Challenges and Best Practices
Learning R programming for data science can feel overwhelming, especially with its vast ecosystem. But with the right approach, we can overcome these challenges and unlock R’s potential.
Common Hurdles
Syntax Differences
- R’s syntax can feel unfamiliar compared to other programming languages.
- Solution: Practice regularly with small scripts.
Debugging Errors
- Errors in R can be tricky to interpret.
- Solution: Use tryCatch() for error handling and read error messages carefully.
Finding the Right Libraries
- With so many options, it’s hard to choose the right one.
- Solution: Focus on widely-used libraries like ggplot2, dplyr, and caret.
Best Practices
Write Clean and Modular Code
- Break code into functions for reusability.
- Add comments to explain logic and steps.
Leverage Built-In Documentation
- Use ?function_name to understand functions quickly.
- Example: Type ?mean to learn about the mean() function.
Update Libraries Regularly
- Run update.packages() to keep libraries up-to-date.
- New versions often fix bugs and add features.
Explore R’s Ecosystem
- Experiment with lesser-known libraries like lubridate for date-time analysis.
- Try creating interactive dashboards using shiny.
Conclusion
R programming for data science is the tool that everyone needs to be working with, as it seems to offer powerful capabilities in data manipulation, visualisation, and machine learning.
From its libraries, such as dplyr for cleaning the data and ggplot2 for producing very impactful visuals, R programming for data science simplifies tasks. Being an open-source language with an active community, this language is, therefore, a very reliable option for professionals across the industry.
Whether it is a matter of forecasting, customer behaviour analysis, or real-world applications in health, R attunes to a variety of needs.
With this blog, it quickly becomes provable that R programming for data science is not a programming language-it’s a whole ecosystem that can help one find new information and make decision-making from data perspectives.
For anyone looking to go to the next level of proficiency, the Advanced Certification Program in Data Science & Analytics offered by Hero Vired is a good opportunity. This course lets participants try out working on practical software like R and Python with in-depth teaching on machine learning, artificial intelligence, and big data analytics.
FAQs
ggplot2, dplyr, and caret are must-haves. They cover visualisation, data manipulation, and machine learning.
R excels in statistical analysis and visualisation. Python is better for deep learning and automation tasks.
Yes, libraries like data.table optimises memory usage for big data.
Healthcare, finance, and genomics are major users of R. It’s also popular in retail and logistics.
Begin with simple scripts and focus on libraries like ggplot2. Use online tutorials and engage with the R community for guidance.
Updated on November 28, 2024


