The study of data science involves applying scientific techniques, problem-solving, implementing different data structure algorithms, building machine learning models, and statistical analysis using languages such as R and Python. All these methods have one aim, which is to extract knowledge and insights from both structured and unstructured data. Python libraries such as Pandas, NumPy, Matplotlib, Scikit Learn, etc., play a significant role in data interpretation.
Several techniques mitigate overfitting in the model, such as cross-validation, regularisation methods (such as L1 and L2 regularisation), and pruning (for decision trees). These techniques also work when we use a simpler model with fewer parameters.
Cross-validation includes splitting the data into multiple subsets to get the performance of the model. Here, we need to train the model on k-1 parts and test on the remaining part.
This process is repeated k times, each time with a different test part. Finally, the obtained results are averaged to get a new estimated performance of the model and better generalisation of the new data.
A table that is used to evaluate any classification model’s performance and gives a final score to find the most optimum model. The matrix consists of the actual classifications vs predicted outcomes with four key values, shown below.
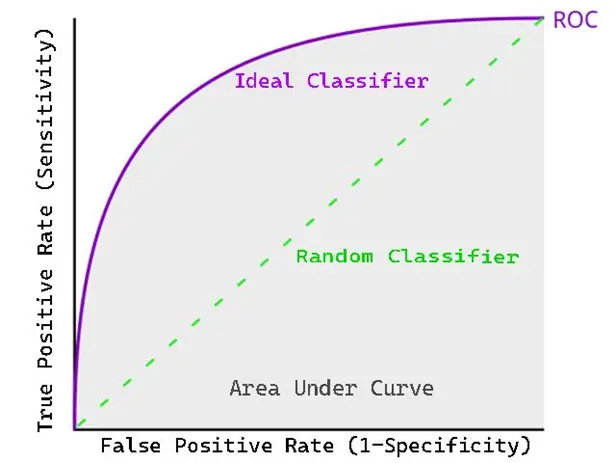
Plotting a Receiver Operating Characteristic (ROC) curve is done to measure the performance of a binary classification model. This is the graph of the true positive rate vs the false positive rate. The higher area under the curve represents its higher ability to solve the question or the model is said to be good in classification.
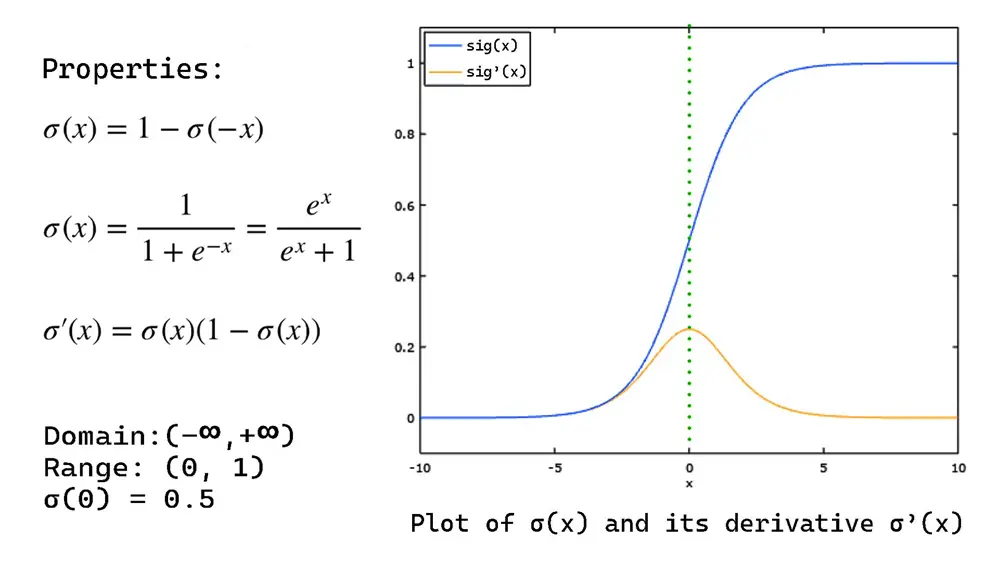
For better comparison (compact dynamic input) and to avoid huge values in matrix multiplication, the sigmoid function is used. It compresses the data between 0 and 1. This S-shaped function is given as:
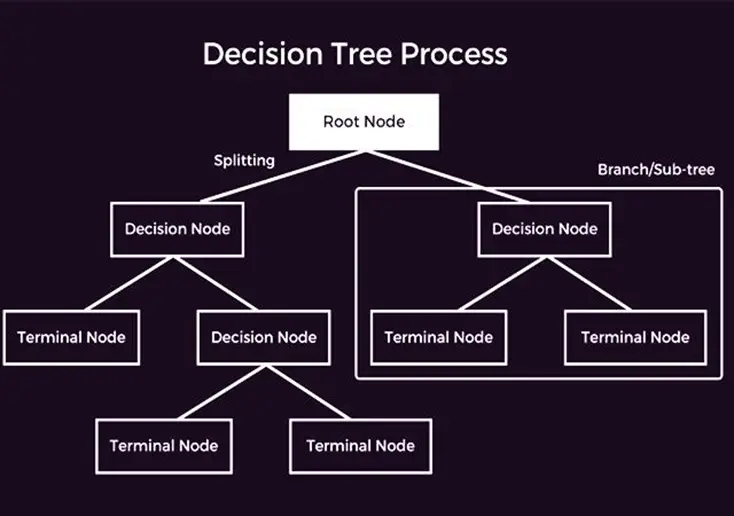
A decision tree is one of the supervised machine learning algorithms that can be implemented for regression and classification. The tree works recursively, splitting the data into subsets and assigning the values in trees according to their input values. The following is the demonstration of the decision tree
The p-value (probability value) is used to assume the null hypothesis is true. When we find a high p-value, our hypothesis is true. Finding a low p-value means there is strong evidence that the null hypothesis is false.
The structured data is stored in predetermined formats such as databases or labelled searchable data, thus it is organised. Unstructured data lacks any labelled entity or predetermined format, which includes images, text, videos, etc. hence it is hard to analyse.
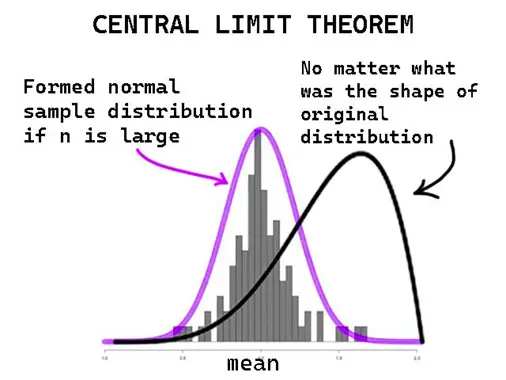
It is a theorem that for large enough samples, the distribution of the sample mean on a graph will be a normal distribution, no matter how it is distributed.
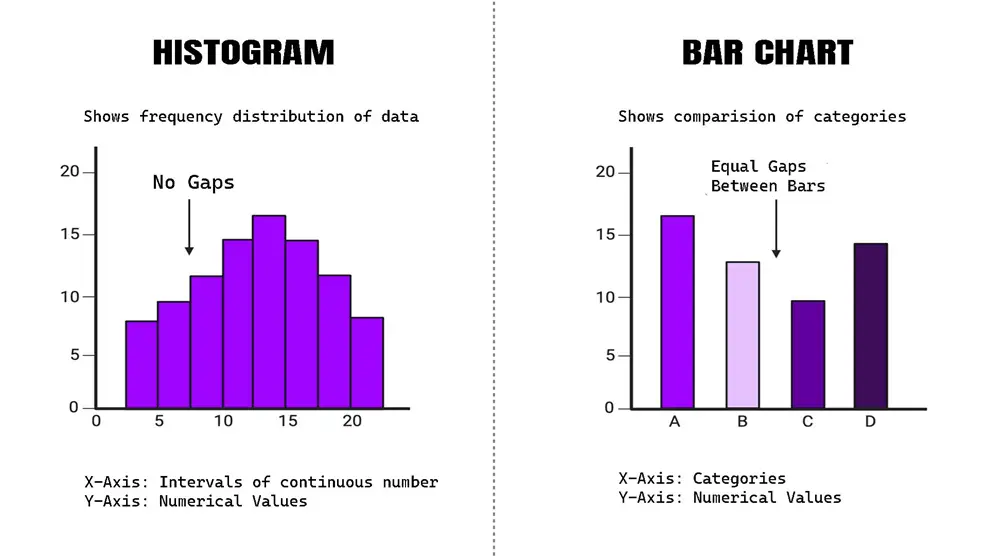
| Feature |
Histogram |
Bar Chart |
| Data Type |
Continuous data |
Categorical Data |
| Bars |
Adjacent bars touch |
Bars are separated by spaces |
X-Axis |
Represents intervals or bins of continuous data |
Represents categories
| Purpose |
Shows the distribution of numerical data |
Compares different categories |
15. What is the difference between classification and regression?
- Classification: It predicts any categorical labels in a dataset. The classes here are pre-defined, and classification assigns input to those classes.
- Regression: The regression outputs continuous numerical values and provides a relationship between input and output variables.

Get curriculum highlights, career paths, industry insights and accelerate your technology journey.
Download brochure
16. Explain the Bias-Variance tradeoff.
Bias occurs due to errors in training data (underfitting), while variance is the variation in the output of training and testing data generated by a model (overfitting). The tradeoff involves finding a model complexity that simplifies both bias and variance and finding the best solution on unseen data.
17. Give formulas to calculate accuracy, precision, recall, and f1-score from a confusion matrix
The values we obtain from a confusion matrix are true positive (TP), true negative (TN), false positive (FP), and false negative (FN). The formulas to calculate are:
- Accuracy: (TP + TN) / (TP + TN + FP + FN)
- Precision: TP / (TP + FP)
- Recall: TP / (TP + FN)
- F1-Score: (2 * precision * recall) / (precision + recall)
18. Describe what ensemble learning is and give examples.
The strength of ensemble learning comes from aggregating many similar models together to reduce errors and increase robustness compared with individual methods. Some examples include Bagging, Boasting, and Stacking.
19. Describe the difference between bagging and boosting.
| Feature |
Bagging |
Boasting |
| Base Learners |
It can train multiple independent models in parallel |
Trains multiple models subsequently each correcting errors of the previous ones. |
| Model Complexity |
It uses high-variance and low-bias models |
It often uses simple models like a decision tree to reduce overfitting |
| Weighting of models |
All models are weighted equally |
Models are weighted based on their performance with more emphasis on correcting the errors |
| Output Combination |
Aggregates predictions through averaging or voting |
Combines predictions using a weighted sum or boosting algorithm |
| Examples |
Random Forest |
Gradient Boosting, AdaBoost |
20. Explain Regularization in Machine Learning.
With the help of regularisation, we can add a penalty to any model’s capacity so that it can prevent the model from fitting the noise in training data. This can be done by adding a regularisation term in the loss function. Hence, we can prevent overfitting in the ML model.
21. Point out the difference between L1 and L2 regularisation.
| Feature |
L1 Regularization (Lasso) |
L2 Regularization (Ridge) |
| Penalty Terms |
Shrinks coefficients but rarely sets them to zero |
Shrinks coefficients but rarely sets them to zero |
Effect on Coefficients |
Encourages sparsity; some coefficients become exactly zero |
Shrinks coefficients but rarely sets them to zero
| Feature Selection |
Performs feature selection by eliminating irrelevant features |
Retains all features but reduces their impact |
| Use Case |
Useful when having many irrelevant features |
Useful for avoiding overfitting with many features |
22. Why is feature engineering so important?
Feature engineering is the process of designing new features, or modifying existing ones, so as to make existing models easier to use, more generalizable, and more accurate when predicting future outcomes.
23. Explain the difference between data augmentation and data synthesis.
Data Augmentation: By applying new transformations on the matrix, like rotation, scaling, etc., new data samples are created. This method is commonly used in text processing to increase data diversity.
Data Synthesis: This method includes generating new data samples by generative models like GANs or VAEs. It’s used when there is insufficient data, hence creating realistic dynamic data.
24. What is the difference between a parametric and a non-parametric model?
Parametric frameworks rely on rigidly defined rules for the relationship between variables, featuring a set quantity of parameters. Conversely, non-parametric frameworks adjust the number of parameters based on the intricacy of the data without committing to a particular structure.
25. What are the assumptions of linear regression?
- Linearity: Independent and dependent variables are linearly related.
- Independence: The observations are independent of one another.
- Homoscedasticity: The hypothesis that the range of residuals (difference between observed and expected values) is the same at all levels of independent variables i.e. the distribution of residuals is the same as the range of expected values over time.
- Normality: The residuals are normally distributed.
- No Multicollinearity: The independent variables are not strongly correlated.
26. Explain PCA and its Implementations.
Principal Component Analysis (PCA) helps to minimise the dataset’s complexity by recognizing the principal components, which are responsible for the highest level of variation within the data.
This method is used highly in areas like data visualisation, especially in data compression, noise minimization, and feature extraction. Features like images and image analysis, biological informatics are extracted.
27. What is SVM, and how does it work?
An example of a supervised learning technique that has gained wide usage is the Support Vector Machine (SVM). This algorithm can be used within both the classification and regression boundaries. SVM finds the hyperplane that most constructively divides various classes within the feature space. It works as:
- Detecting the Hyperplane: SVM identifies this hyperplane that increases the gap between the closest data points significantly from each class, known as support vectors.
- Kernel: It’s necessary to take input features to a higher dimensional space and it can be possible using a kernel function.
- Margin: This is the place between the hyperplane and the closest data point in each class. SVM seeks to maximise this margin, enhancing the ability to predict data not seen during training. Further optimization of SVM is also possible.
28. What is k-means clustering, and describe its applications?
One of the most used algorithms in unsupervised learning is k-means clustering because it can categorise data into clusters by comparing similarities between data points. It can cluster all observations into k groups using the cluster’s mean average.
k-means clustering easily facilitates applications like customer segmentation, genetic clustering, anomaly detection, etc.
29. What is Covariance, and how is it used?
Covariance shows the connection between the variables. To show the nature of variables, if the covariance is high, that means the variables move in the same direction, i.e. rising or falling together.
If one of the variables goes up and the other goes down, the covariance will be negative. Covariance is also a useful measure in portfolio theory and risk management.
30. Point out the difference between k-means and hierarchical clustering.
| Feature |
K-Means Clustering |
Hierarchical Clustering |
| No. of Clusters |
Requires number of clusters (k) |
Does not require a pre-specified number of clusters |
| Cluster Formation |
Outputs k clusters based on centroids |
Output clusters based on the distance between data points |
| Cluster Hierarchy |
Does not provide a hierarchy |
Produce a hierarchy of clusters in a tree-like structure |
| Complexity |
Faster and more scalable for large datasets |
Slower and less scalable for large datasets |
| Result |
May produce different results each run due to random initialization |
Produces more stable results because of hierarchy |
| Example |
Customer Segmentation based on purchase behaviour |
Biological Taxonomy based on genetic similarities |
Advanced-Level Data Science Interview Questions
31. Point out the difference between batch gradient descent and stochastic gradient descent.
Batch Gradient Descent calculates the gradient by using the whole dataset, which is appropriate for datasets that are smaller but take more time. On the other hand, Stochastic Gradient Descent calculates the gradient by focusing on a single data point, making it quicker for bigger datasets but introducing more variability.
32. What are some common techniques for feature selection in machine learning?
- Filter Methods: Use statistical analysis to choose the most relevant characteristics.
- Wrapper Methods: Employ a particular model to assess smaller groups of characteristics and pick the most effective one.
- Embedded Techniques: Incorporate feature selection into the training of the model, such as LASSO. Apply filter techniques for the initial selection, wrapper techniques for datasets of moderate size, and internal techniques for extensive datasets.
33. How would you implement k-fold cross-validation for a machine learning model?
- Divide the data into k smaller groups (folds).
- For every group, select k-1 smaller groups for learning and the last group for checking accuracy.
- Then combine the outcomes to find the overall performance of that model.
34. Explain the concept of LDA and its use in topic modelling.
LDA (Latent Dirichlet Allocation) is a technique to categorise the given text into a document by assuming documents are like a mixture of topics, and the topics are a combination of words. Hence, it optimises all the distributions via an iterative process by this assumption.
35. Give Some Techniques For Optimising The Hyperparameter.
Some of the methods for optimising hyperparameters are:
- Random Search
- Bayesian Search
- Grid Search
- Sequential
- Model-Based
- Optimization
- Genetic Algorithms
- Tree-structured Parzen Estimator (TPE)
- Gradient-Based Optimization and Hyperband.
36. Can you explain “word embedding” in NLP? How is it used in text analysis?
One of the initial tasks in Natural Language Processing (NLP) is “word embedding” which represents words as points in vector space. It captures the meaningful connections among words by considering their context within a collection of texts. For determining the sentiment of text, document categorising and also in text translation, word embeddings are applied. This also helps in increasing the effectiveness of several models.
37. How are autoencoders used for dimensionality reduction?
Autoencoders are unsupervised neural networks in which encoders and decoders are able to create a new version of the same data for the reason that it can convert an input that is close to an output.
Hence, an autoencoder can be trained to gain as much information as possible from the original data and encode them into the most reduced form possible, preserving its main key components. That is how input is dimensionally reduced into simpler forms and lowers the complexity of the input.
38. Describe the process of outlier detection in a dataset. What techniques can be used to identify and handle outliers?
Here are the methods mentioned to identify anomalies or datasets that are different from the majority of the dataset:
- Standard Deviation: Entries that are more than a certain number of standard deviations away from the average are labelled as anomalies.
- Box Plot: Anomalies are marked as entries that fall outside the box plot’s whiskers.
- DBSCAN: A clustering technique that marks anomalies as points in areas with low density.
- Isolation Forest: A combination approach that separates anomalies by randomly dividing data points.
- Z-Score: At last using the Z-score as the final criteria, anomalies can be found.
39. Spot the difference between batch processing and stream processing
| Feature |
Batch Processing |
Stream Processing |
| Data Handling |
Processes large blocks of data at scheduled intervals. |
Processes data continuously in real time. |
| Latency |
Higher latency; results are available after batch completion. |
Low latency; results are available almost immediately. |
| Use Cases |
Suitable for end-of-day reports, backups, and ETL processes. |
Suitable for real-time analytics, monitoring, and alerting. |
| Resource Usage |
Often requires significant resources at specific times. |
Spreads resource usage more evenly over time. |
| Complexity |
Simpler to implement and manage. |
More complex, requiring handling of real-time data streams. |
| Examples |
Hadoop, Apache Spark (Batch mode). |
Apache Kafka, Apache Flink, Apache Storm. |
40. Explain the concept of kernel methods in machine learning. How are kernel functions used to transform data in higher-dimensional spaces?
In machine learning, kernel methods employ kernel functions to subtly transform data into more complex dimensions without directly computing the transformed feature vectors. This capability enables linear algorithms to represent non-linear patterns within the data.
The transformed feature vector, however, is simply the dot product of two transformed feature vectors computed in the higher-dimensional space. By these means, we can construct arbitrarily complicated decision boundaries in the input space.
41. What is the difference between a generative model and a discriminative model?
| Feature |
Generative Model |
Discriminative Model |
| Objective |
Learn the joint probability distribution of the input features and the labels. |
Learn the conditional probability of the labels given the input features. |
| Output |
It can generate new data similar to the training data. |
Only predicts the labels for the input data. |
| Complexity |
Typically more complex, as they model the entire distribution. |
Generally simpler, as they focus on modelling the decision boundary. |
42. How would you approach a time series forecasting problem?
- Data Cleaning: Remove any inconsistencies, address any missing information, and make sure the data is in an appropriate structure.
- Data Exploration: Identify the fundamental patterns and movements within the data.
- Selecting a Model: Pick an appropriate forecasting model that matches the data’s features and needs.
- Training the Model: Educate the chosen model with past data.
- Assessing the Model: Measure how well the model works with test data.
- Generating Forecasts: Create predictions for upcoming periods.
43. Explain the concept of Bayesian inference.
Bayesian inference is a mathematical method of statistical reasoning that uses an application of Bayes’ theorem to update the probability of a hypothesis in new data. In the context of machine learning, Bayesian inference is used to determine parameter values in models, make predictions, and estimate the uncertainty of those predictions.
44. State the difference between batch normalisation and layer normalisation in deep learning.
Batch Normalisation:
- Adjusts activations across the batch axis.
- Ideal for feedforward networks and convolutional neural networks (CNNs).
- Usually applied before the activation function.
Layer Normalisation:
- Adjusts activations across the feature axis for every data instance.
- Ideal for RNN.
- Applied within the hidden layers of the network.
45. Explain how GANs can generate new data samples.
Generative Adversarial Networks (GANs) are made up of two interconnected neural networks: a creator and an evaluator. The creator produces artificial data, and the evaluator can tell the difference between genuine and artificial data.
They undergo training in a competitive manner, with the creator improving its ability to produce more lifelike data to deceive the evaluator and the evaluator enhancing its skill in identifying genuine from artificial data. This rivalry results in the creator being able to produce data that closely resembles real data, thereby creating new data samples.
46. How can pre-trained models be used to improve the performance of a new model?
You can retrain the model on a different dataset, tuning the insights you already have based on learning one task towards another, and you can ‘reinforce’ your task via fewer training hours and less data.
47. How do we evaluate the performance of a recommendation system and assess its effectiveness?
- Precision and Recall: Evaluate how well the system suggests relevant items.
- Mean Average Precision (MAP): Calculates the average precision for all users.
- Normalised Discounted Cumulative Gain (NDCG): Measures how good the items that the system ranked turn out to be.
- Checking Diversity: Evaluate the variety of items recommended to meet various user preferences.
48. Provide the difference between a parametric model and a non-parametric model.
| Feature |
Parametric Model |
Non-Parametric Model |
| Assumptions |
Assumes a specific functional form of the relationship. |
Does not assume a specific functional form. |
| Number of Parameters |
Has a fixed number of parameters. |
Has a flexible number of parameters. |
| Parameter Learning |
Parameters are learned from the data. |
Parameters grow with the amount of data. |
| Examples |
Linear and Logistic Regression. |
Decision Trees, k-Nearest Neighbors, SVM with RBF Kernel. |
49. Explain the concept of feature hashing and how it is used to handle high-dimensional data in machine learning.
As a strategy to ease working with high-dimensional data, feature hashing (also known as the hashing trick) reduces the dimensions of data by turning them into a feature vector of fixed length. It uses a hash function that transforms the original features into a smaller set of hash values.
This approach facilitates easier storage and processing, particularly when handling extensive datasets containing numerous features. Nevertheless, this can lead to collisions between regions of feature space in which various features have the same hash value potentially affecting the model performance.
50. What are the advantages and disadvantages of using neural networks for deep learning?
Advantages:
- Capable of understanding intricate patterns within data.
- Effortless with data that lacks a defined structure, such as photos and written content.
Disadvantages:
- Need significant data volumes.
- At risk of overfitting.
- Intensive in terms of computational resources.
Case Study-Based Data Science Interview Questions
51. How would you handle a situation where there are more features than observations in a dataset?
Suppose your dataset has more features than observations. In that case, you can employ methods such as feature selection, dimensionality reduction (like PCA), or regularisation (such as L1 regularisation) to decrease the feature space and avoid overfitting. This contributes to enhancing model effectiveness and understandability.
52. How would you approach a problem where your data contains both numerical and categorical variables?
To handle a dataset with both numerical and categorical variables, we first need to clean the data, encode the variables using one-hot encoding, and normalise all numerical values. We then take an ML model that supports mixed data types, such as random forests or decision trees.
53. How can you detect the model drift?
The decrease in the performance of an ML model over time due to changes in data distribution is called model drift. It can be detected by metrics to perform model efficiency outcomes and more statistical tests on those data distributions. Comparing actual outcomes using several drift detection methods aids in validation checks.
54. What is the purpose of stratified sampling, and when would you use it?
The main purpose of stratified sampling is to ensure that each subgroup within a given population in a dataset is sufficient. It is used to maintain the proportion of different categories or classes within the dataset for a balanced representation.
55. You are given a dataset of customer reviews for a product. How would you perform sentiment analysis to understand customer satisfaction?
Performing sentiment analysis is one of the most important parts of knowing the nature of customer reviews. Preprocessing the data by converting normal text to numerical features using methods like word embeddings or TF-IDF extracts all relations in vectors. And then applying a classification model like Naive Bayes to those vectors to know if the sentiments are positive, negative, or neutral.
56. What is the role of the Fourier transform in signal processing? How is it applied in data science?
In Fourier transformation, a signal is decomposed into its constituent frequencies, its most calculative format. Using that, we can do the analysis of its frequency components using data science models. It is used in signal denoising, feature extraction in time-series data, and also in transforming data into frequency for analysis and modelling.
57. Describe the steps you would take to build and implement a predictive maintenance model.
- Gather and prepare data from sensors.
- Establish criteria for failure.
- Choose an algorithm for machine learning.
- Train the model using past data.
- Evaluate the model’s effectiveness.
- Deploy the model for real-time predictions.
58. What are the key steps in a data science project?
- Problem origin and analysis
- Data Collection
- Exploratory Data Analysis
- Feature Engineering
- Model Selection & Training
- Model Evaluation
- Model Tuning
- Deployment
- Monitoring and Maintenance
59. What are some common techniques for anomaly detection in machine learning? How would you apply these techniques to detect fraudulent activities?
You could implement these methods:
- Isolation Forest
- One-Class SVM
- Autoencoders
- Density-Based Methods
60. How do you handle imbalanced classes in a classification problem? What techniques can be used to address the class imbalance?
Following are the techniques to handle imbalanced classes.
- Resampling
- Algorithmic class imbalance check
- Generating synthetic samples
- Class weighting
- Use of algorithms like random forest or gradient boosting
- Ensemble techniques
61. How do you handle missing data in a dataset? What are some common imputation techniques?
For this type of query, you can delete rows or columns with missing values, but it could not work all the time. Rather, finding missing values with mean, median, or mode and also include KNN imputation to estimate missing values.
Moreover, filling the missing values based on the last known value (forward fill) or the next known value (backward fill) will deal with this situation. Depending upon the task and model, we could put different estimates to refill the empty spaces with assumptions.
62. What are some challenges you might encounter when working with big data? How would you address these challenges?
Some challenges with big data include scalability, storage, and processing speed. Address these by using distributed computing frameworks (like Hadoop or Spark), data partitioning, and efficient algorithms.
63. Describe a complex machine learning project you worked on. What were the key challenges, and how did you overcome them?
You can add any of your ML projects for this. But make sure to follow a format: first, give a short overview of the project, then assess the problems you faced, like imbalanced data or missing data and feature engineering, and then answer the solution to those problems.
64. What are some ethical considerations you need to keep in mind when working with data science projects? How would you ensure that your models are fair and unbiased?
Ethical considerations in data science include privacy, consent, and bias. To ensure fairness, use representative datasets, regularly audit models for bias, and involve diverse teams in model development.
65. Is it always necessary to process the data of the customer in some financial organisation, or do you expect the data provided to be pre-processed?
In many cases, organisations prefer to receive pre-processed data to ensure consistency and accuracy. However, the level of processing required can vary based on the organisation’s specific needs and capabilities. You must generally prefer pre-processing the data to avoid any anomaly that could affect your results significantly.
66. How would you detect fake news on social media?
Taking the source verification, network analysis, and caption text analysis could help initially. After that, these steps could help:
- Text-classification-based training on fake news dataset
- Using NLP techniques to resolve linguistic Indifference
- Deep learning models like RNN
- Ensembling different fake news-trained models
67. What data sources would you consider and why?
This answer could vary a lot, but you must mention only the trusted sources where you can find datasets. For example, Kaggle and Wiki.
68. Which optimization algorithms would you consider?
One optimising method could be Stochastic Gradient Descent (SGD) for its efficiency in handling large datasets and Adam for its adaptive learning rate and momentum, which can lead to faster convergence and better performance in many cases.
69. What clustering techniques would you use and why?
Consider using K-means because of its ease of use and it can handle large amounts of data very well. DBSCAN can also be used for its skill in spotting groups of different forms and dimensions without needing to set a specific number of groups in advance.
70. How would you analyse and forecast electricity consumption for a city using historical data?
You would collect historical electricity consumption data, analyse trends and patterns, engineer relevant features, select a forecasting model like ARIMA or LSTM, train the model, and use it to forecast future electricity consumption for the city.
Behavioural Questions In Data Science Interview
71. How do you handle tight deadlines and prioritise tasks in your projects?
It is important to prioritise tasks based on their urgency and impact. Divide tasks into smaller sections, establish specific milestones, and utilise project management software to monitor advancement and ensure projects are finished on time.
72. Describe a time when you had to explain a complex data analysis to a non-technical stakeholder. How did you ensure they understood?
You can simplify the main points, incorporate visual aids such as charts and graphs, and connect the results to their business implications. Promote inquiries for clarity and adapt explanations according to their input.
73. How do you stay updated with the latest developments and trends in data science?
The most significant way of this today would be the internet. Tons of research papers and blogs are more than enough to keep up with the latest developments. Also, reading industry journals, social media, conferences, and webinars, enrolling in online courses, and engaging in relevant online communities etc. would also help.
74. Tell me about a time when you had to make a decision with incomplete data. How did you approach it?
When you have limited information, assess what is available, identify missing key points, and think about how those gaps could affect your decision-making. Next, rely on your own intuition, consult with specialists, and make educated guesses using your past expertise and learnings. Ultimately, you observe the results and make changes based on updated information.
75. Describe a situation where you had to use data to convince someone to change their perspective or approach.
Here, collecting appropriate data and displaying it using visuals such as charts or graphs is important. Emphasise the main ideas and how they back the fresh view, acknowledging possible worries and showcasing the advantages of the suggested modification. This aids in constructing a convincing argument supported by evidence.
76. How do you handle ambiguity in a project without clearly defined requirements?
Frequent communication with the stakeholders will help in gathering any related information regarding ambiguity in a project. Defining goals and task management afterwards is also important. Prioritising tasks and dividing projects into small tasks will help to conquer ambiguity.
77. Describe a situation where you identified a significant error in your analysis. How did you handle it?
Confirmation of the error is the key to starting the fixing process. Here, answer any significant error you find while working on any model, explain how to solve the problem, and indicate whether any team member is affected by/helping with the situation.
78. Tell me about a time when you had to learn a new tool or technology quickly to complete a project.
The first step is to research and grasp the fundamentals using tutorials and documentation. Next, you utilise this information for minor duties in the project, reaching out to coworkers or internet forums for assistance when necessary. By deconstructing the learning process and maintaining regular practice, you effectively incorporate the new tool into your work routine to meet the project deadline.
79. How do you ensure your analyses and models are reproducible?
To guarantee the reproducibility of analyses and models, it is important to document every step of the workflow, such as data preprocessing, feature engineering, model selection, and evaluation metrics. Git is employed to monitor modifications and cooperate with peers. Sharing code, data, and documentation enables others to replicate your findings.
80. Describe a time when you had to balance multiple projects at once. How did you manage your time and resources?
When juggling several projects, you organise tasks by their deadlines and level of significance. You divide every project into smaller, manageable tasks and either make a schedule or utilise project management tools to monitor advancement. Consistent stakeholder communication is important for setting and meeting project expectations and goals. Deadline handling is the key task here to prevent any loss.
Frequently Asked Domain-Specific Questions
81. How would you use data analysis to improve network performance and customer satisfaction?
Analysing data can enhance network performance by detecting and fixing bottlenecks, foreseeing equipment breakdowns, and fine-tuning network setups.
82. How would you use customer purchase history to improve product recommendations?
This question is generally asked in E-commerce organisations or related domains in data science. Here, you can utilise recommendation algorithms such as collaborative filtering or those based on user purchase history and behaviour patterns of similar users.
83. Can you explain the concept of risk management in financial modelling?
Risk management is one of the most important roles in finance. It’s a responsible task for both organisations while maintaining data integrity, and several policies should be made through the risk management process. It can be done by categorising and prioritising risks and then evaluating and addressing the required solutions.
84. How can data analytics help optimise inventory management in a retail setting?
Analysing data can improve inventory control by predicting demand, spotting patterns, and optimising pricing and promotions using customer actions
.
85. How would you use machine learning to predict patient outcomes or diagnose diseases?
Machine learning is able to anticipate patient results by examining information on patients, such as their demographics, medical background, and laboratory findings, in order to recognize trends that may suggest specific conditions or results.
86. Mention ways to increase the effectiveness of a marketing campaign using data analytics.
Data analytics tools and techniques are used to measure effectiveness through metrics such as:
- Customer Acquisition Cost (CAC)
- Customer Lifetime Value (CLV)
- Return On Investment (ROI)
87. How can you analyse user engagement and sentiment on social media platforms?
The analysis of user interaction and feelings towards content can be done through natural language processing (NLP) to determine user engagement and sentiment.
88. How would you use data science to optimise energy consumption or predict energy demand?
By examining usage patterns, pinpointing areas of inefficiency, and suggesting energy-saving measures, data science has the potential to enhance energy consumption efficiency.
89. Can you explain how data analysis can improve traffic flow or public transportation efficiency?
Analysing data can enhance traffic flow by examining traffic patterns, pinpointing congestion points, and optimising traffic signal timings.
90. How can data analytics be used to improve quality control or predictive maintenance in manufacturing processes?
Early defect detection is the key to enhancing quality control in any manufacturing process. Data analytics can help a lot by using several data processing techniques to monitor any defects early in the process. After addressing the problem, instant solutions, maintenance requirements, and optimization are carried out.
Ethics and Best Practices Questions in Data Science Interview
91. How do you handle sensitive or personal data to ensure privacy and security?
- Anonymise or pseudonymise personal data.
- Implement strong data encryption.
- Limit access to sensitive data.
92. How do you address bias in your data and models to ensure fairness?
One of the most important things for smoothly running a model is checking for biases at regular intervals. All the data is dynamic to keep the model up to date. But the dynamic data often brings many variations, and hence, sometimes we need to change the data pre-processing methods also. Several methods can be used to detect biases in the model and by this, we can promote fairness and flexibility.
93. Who owns the data used in your data science projects?
In data science projects, the ownership of the data used can vary depending on the source and context. In most cases, the organisation that receives the data has the right to own it. There are many deep-level privacy policies regarding data ownership, and one must follow them while sharing data.
94. Do you have any method to share data and findings with other researchers or organisations?
Sharing data with other organisations alone brings many data processing procedures. The raw data can harm the integrity and policy of both research organisations. Mutual understanding is also required to avoid any small error conflicts.
95. How do you ensure that your models are deployed responsibly and do not cause harm?
To ensure this, all the model deployments should be done responsibly and simultaneously conducting comprehensive tests. Keeping track of how the models are performing establishes a way for use to ensure it does not cause any harm to the organisation.
96. How do you monitor the performance of machine learning models dynamically? Can this process be automated?
This can be done through various methods, including:
- Metrics Tracking
- Data and Model Drift Detection
- Feedback Loops
- Automated Alerts
- Fine-tuning or Re-training the same model
- Model Updation
Yes, this process can be automated using some popular tools like TensorBoard, Google Cloud AI platform, Databricks, Kubeflow, Amazon SageMaker, etc.
97. How to make sure that your projects comply with ethical standards and regulations?
This includes respecting the privacy of the data holder and ensuring its data security. It also includes maintaining a secure way of transferring data to avoid any hindrance and maintaining transparency in methodologies and results. By following these principles, data scientists can ensure that their work benefits society without causing harm or infringing on individuals’ rights.
98. Your task is to secure transparency in your projects.
Mention your approach. Proper documentation is a must when we talk about transparency. It also involves clarifying model choices and forecasts and granting access to model code and documentation. Prioritising transparency allows data scientists to establish trust with stakeholders and guarantee accountability in their work.
99. Can you ensure that the data you collect is obtained ethically and legally?
Gaining consent for data collection is an important part of ethical data collection. Furthermore, gathering only the required data, with no additional data collection that can affect the privacy of anyone, is a good practice. Adhering to data protection laws, transparent data transfer, and respectful and mutual sharing of data are some good practices.
100. How do you ensure the quality and reliability of your data?
Regularly checking all the following key practices helps in maintaining the quality of your data:
- Regular Data Cleaning
- Data Validation
- Data Transformation
- Data Integration and Backup
- Proper documentation of all types of datasets
- Regular Audits
- User Feedback is also important
Conclusion
In conclusion, these interview questions have a wide range of applications all over the data science field. Both the technical and non-technical aspects of interview questions are covered. Interviewers would easily generate new questions. Hence, it all depends on how well you prepare. Hope these questions helped you to get an idea of what the interviewer asks.