In a world in which data determines nearly everything, selecting the correct tool to analyse data is critical to making good decisions. Most of us find it difficult to make sense of mountains of numbers, searching for clues that will lead us to the next big step.
Python stands out as a top choice for tackling this challenge a tool that’s as accessible as it is powerful.
Why Python, though?
Python’s popularity isn’t just hype. It’s so easy to learn, it has a massive community, and there are libraries that can do everything from simple calculations to complex data models. And, let’s be real, it doesn’t hurt that Python is free and constantly updated.
This blog breaks down how Python for data analysis works, taking us hand-by-hand through the process, the tools and the tricks to breathe life into our data.
What is Data Analysis?
Data analysis involves the ‘examination, cleaning, transformation, and modelling of raw data to discover useful information and inform decisions’. It’s an essential step in transforming data into useful knowledge, and it usually informs business strategy, product design or operational effectiveness.
By recognizing the patterns, trends, and pigments of the future, the analysis of data provides insight into past behaviour, sets expectations for and initiatives toward the future, and lets valid choices be made thereafter.
Also Read: Exploratory Data Analysis

POSTGRADUATE PROGRAM IN
Data Science & AIML
Learn Data Science, AI & ML to turn raw data into powerful, predictive insights.
Key Benefits of Using Python for Data Analysis Across Industries
Here’s why Python for data analysis works so well:
Easy to Learn and Use
Python is the easiest language to write and read because of its extremely simple syntax compared to other languages.
Wide Range of Libraries
Python also has nice libraries such as Pandas for working with data, NumPy for numerical data, and Matplotlib for making plots.
Scalable for All Data Sizes
Whether we’re working with a small dataset in Excel or analysing millions of data points, Python scales up without skipping a beat.
Cross-platform and Community Support
Python works across different operating systems – Windows, macOS, Linux – and has a huge community ready to help.
Perfect for Integration with Machine Learning
Python doesn’t just stop at data analysis. We can easily integrate machine learning tools like TensorFlow or Scikit-Learn for deeper insights and predictive modelling.
Types of Data Analytics in Python: Descriptive, Predictive, and Prescriptive Approaches
So, let’s take a look at the various techniques we can use to process data with Python.
Descriptive Analytics: Looking Backward to See Patterns
This is all about understanding what has already happened. If we’re examining monthly sales, say, descriptive analytics would tell us which months performed best or worst.
Predictive Analytics: Forecasting What’s Coming
Here, we’re not just looking at past data; we’re using it to make predictions. Python has its libraries like Scikit-Learn, through which we are in a position to develop models to predict future trends such as demand or customer churn rate.
Prescriptive Analytics: Making the Best Decision
Prescriptive analytics takes the next step, advising what to do with the data. If we have insight into what will be in demand for an item, prescriptive analytics can advise us on how we need to tweak pricing or promotion in order to make the most money.
Step-by-Step Process for Effective Data Analysis
We’re about to get to analysing data, but how? Data analysis typically follows a few core steps.
Step 1: Data Collection
Data can come from everywhere: spreadsheets, databases, APIs, and even web scraping. Python’s packages, such as pandas and requests, allow for the easy pulling of data from a variety of sources.
Step 2: Data Preparation
Real data is dirty, has duplicates, missing values, and different formats, which can really screw up our analysis. Data preparation is the act of cleaning and organising data into a shape that can be analysed properly.
Step 3: Data Exploration
Before prediction, always plot the data first to see for trends, outliers and relationships. There are libraries (like Matplotlib and Seaborn) that make plotting graphs and charts easy.
Step 4: Data Modelling
When we identify patterns, then we can construct models to guess values ahead. If, say, sales are seasonal, then one would prefer to employ a time-series model. Python’s Scikit-Learn library provides tools for this.
Step 5: Result Interpretation
After building the model, it’s crucial to interpret the findings in a way that helps us make decisions. This step involves the comparison of predictions with how things have unfolded and deciding what to do next in light of this information.

82.9%
of professionals don't believe their degree can help them get ahead at work.
Essential Libraries in Python for Data Analysis and Visualisation
So, let’s consider the critical library elements that have made Python for data analysis such a pleasant, productive tool.
Also Read: Top 10 Python Libraries
NumPy
Most of the numerical computing in Python is based on NumPy. When dealing with big data sets or big computations, NumPy’s array-like structure is much faster.
NumPy helps us manage data as multi-dimensional arrays, making calculations fast and easy.
Key Functions:
- Creating Arrays: Use np.array() to create simple arrays.
- Array Operations: Do addition, subtraction, or multiplication on arrays.
- Statistics: Find mean, median, standard deviation, and all that stuff easily.
Example Code:
import numpy as np

# Creating an array with random values

data = np.array([45, 23, 67, 89, 100])

# Calculating the mean

mean_value = np.mean(data)

print("Mean:", mean_value)
Output:
Mean: 64.8
Pandas
NumPy is great for numbers, but Pandas can’t be beaten for tables of data. It’s the library we turn to when we are dealing with tables of rows and columns, such as Excel or SQL.
Pandas enable one to read data from a given data source, clean up and extract the necessary data. They are great for turning a larger set of data, which may contain many values that are hard to quantify, into manageable and easy to analyse data.
Key Functions:
- DataFrames: The main structure, like a table, where rows and columns can be manipulated easily.
- Reading and Writing Files: Load data from CSV, Excel, or even SQL databases with pd.read_csv() or pd.read_sql().
- Data Cleaning: Handle missing values, filter rows, and sort columns effortlessly.
Example Code:
import pandas as pd

# Loading a sample dataset

data = {

'Name': ['Rahul', 'Ananya', 'Priya', 'Deepak', 'Kavya'],

'Age': [23, 25, 21, 30, 24],

'Score': [88, 92, 75, 85, 91]

}

df = pd.DataFrame(data)

# Displaying the DataFrame

print("Student Data:")

print(df)
Output:
Student Data:
| Name | Age | Score | |
| 0 | Rahul | 23 | 88 |
| 1 | Ananya | 25 | 92 |
| 2 | Priya | 21 | 75 |
| 3 | Deepak | 30 | 85 |
| 4 | Kavya | 24 | 91 |
Matplotlib and Seaborn
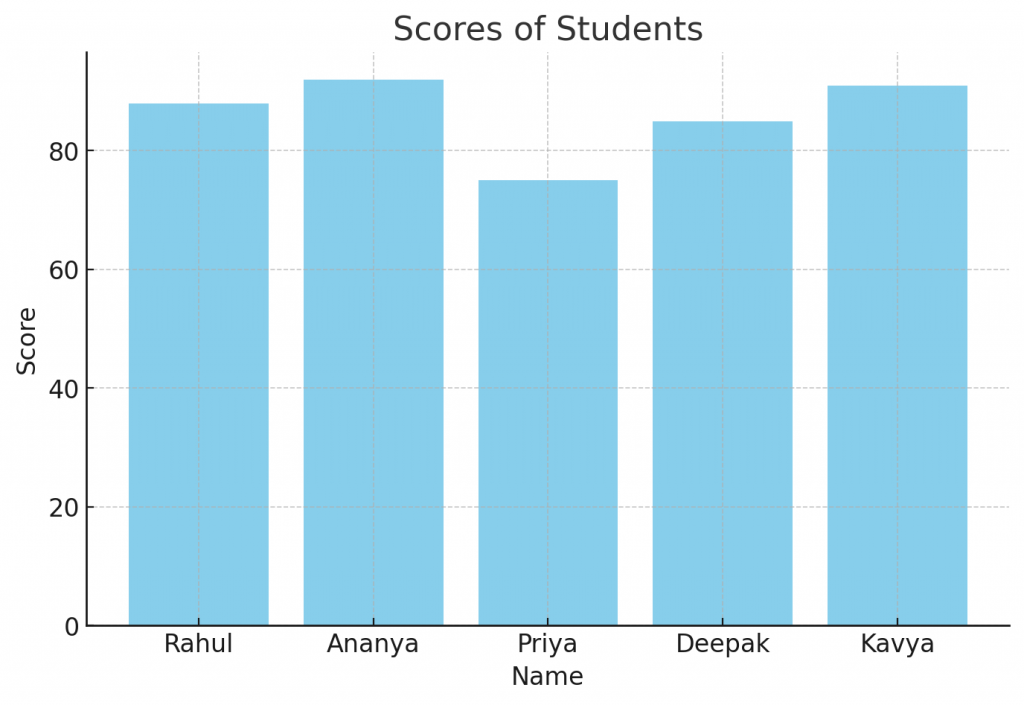
Data analysis doesn’t end with numbers. We need visuals to make insights clear, and Matplotlib and Seaborn are our go-to tools for this.
Matplotlib is great for basic charts and graphs. We can create line graphs, scatter plots, bar charts, and more.
Built on top of Matplotlib, Seaborn is designed for statistical plots and adds polish to our visuals with easy colour themes and layouts.
Example Code (Basic Bar Chart with Matplotlib):
import matplotlib.pyplot as plt

# Sample data

names = ['Rahul', 'Ananya', 'Priya', 'Deepak', 'Kavya']

scores = [88, 92, 75, 85, 91]

# Plotting a bar chart

plt.bar(names, scores, color='skyblue')

plt.xlabel('Name')

plt.ylabel('Score')

plt.title('Scores of Students')

plt.show()
Output:

SciPy
Sometimes, we need more than basic calculations, especially in fields like engineering or scientific research. That’s where SciPy steps in, extending NumPy’s capabilities.
SciPy is a library that handles advanced mathematical operations, like optimization, statistics, and signal processing.
Example Use Cases:
- Solving equations
- Optimising mathematical functions
- Working with probability distributions
Example Code (Finding a Root of a Function):
from scipy.optimize import root

# Defining a function

def func(x):

return x * x - 4

# Finding the root of the function

solution = root(func, 0.5)

print("Root:", solution.x)
Output:
Root: [2.]
Using NumPy for Effective Numerical Data Processing and Analysis
NumPy makes working with numerical data easier, allowing us to manage everything from basic sums to complicated mathematical models. Let’s delve deeper into what makes NumPy so valuable in Python for data analysis.
Multi-dimensional Arrays
NumPy lets us handle large amounts of data in multi-dimensional arrays, making it quick to perform calculations across rows or columns.
Statistical Analysis
With functions for calculating mean, median, variance, and standard deviation, NumPy makes summarising data a breeze.
Broadcasting
This feature allows us to apply operations across different shapes, a powerful tool when dealing with arrays of varying dimensions.
Example Code (Statistical Analysis):
import numpy as np

data = np.array([23, 19, 25, 30, 18, 22])

print("Mean:", np.mean(data))

print("Standard Deviation:", np.std(data))
Output:
Mean: 22.833333333333332

Standard Deviation: 3.975620147292188
Manipulating Tabular Data with Pandas for Insightful Analysis
When it comes to manipulating tabular data, Pandas is the library that makes everything simple.
Data Loading
Pandas can load data from many sources – CSV files, Excel sheets, or SQL databases – all with just a few lines of code.
Cleaning and Transforming Data
From dropping duplicates to filling in missing values, Pandas helps us prepare data for deeper analysis.
Filtering and Grouping
With functions like groupby() and filter(), we can easily sort and organise data to get exactly what we need.
Example Code (Grouping and Filtering Data):
data = {

'Name': ['Rahul', 'Ananya', 'Priya', 'Deepak', 'Kavya'],

'City': ['Delhi', 'Mumbai', 'Delhi', 'Chennai', 'Mumbai'],

'Score': [88, 92, 75, 85, 91]

}

df = pd.DataFrame(data)

# Grouping by city and calculating the mean score

city_group = df.groupby('City').mean()

print("Average Score by City:")

print(city_group)
Output:
Average Score by City:
| City | Score |
| Chennai | 85.0 |
| Delhi | 81.5 |
| Mumbai | 91.5 |
Data Visualisation Techniques in Python with Matplotlib and Seaborn
Once our data is ready, visualisation makes our insights easy to understand.
Using Matplotlib for Visualisations
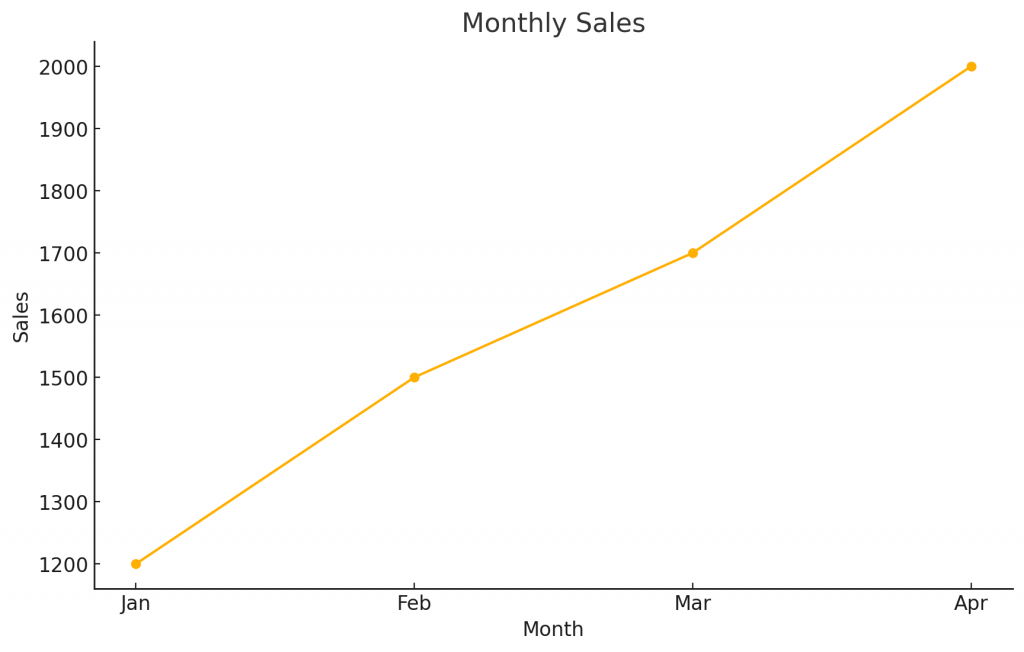
Matplotlib is our basic tool for creating simple, clear charts. From line graphs to bar charts, it covers the essentials.
Example Code (Line Plot):
months = ['Jan', 'Feb', 'Mar', 'Apr']

sales = [1200, 1500, 1700, 2000]

plt.plot(months, sales, marker='o')

plt.title("Monthly Sales")

plt.xlabel("Month")

plt.ylabel("Sales")

plt.grid()

plt.show()
Output:

Using Seaborn for Advanced Visualisations
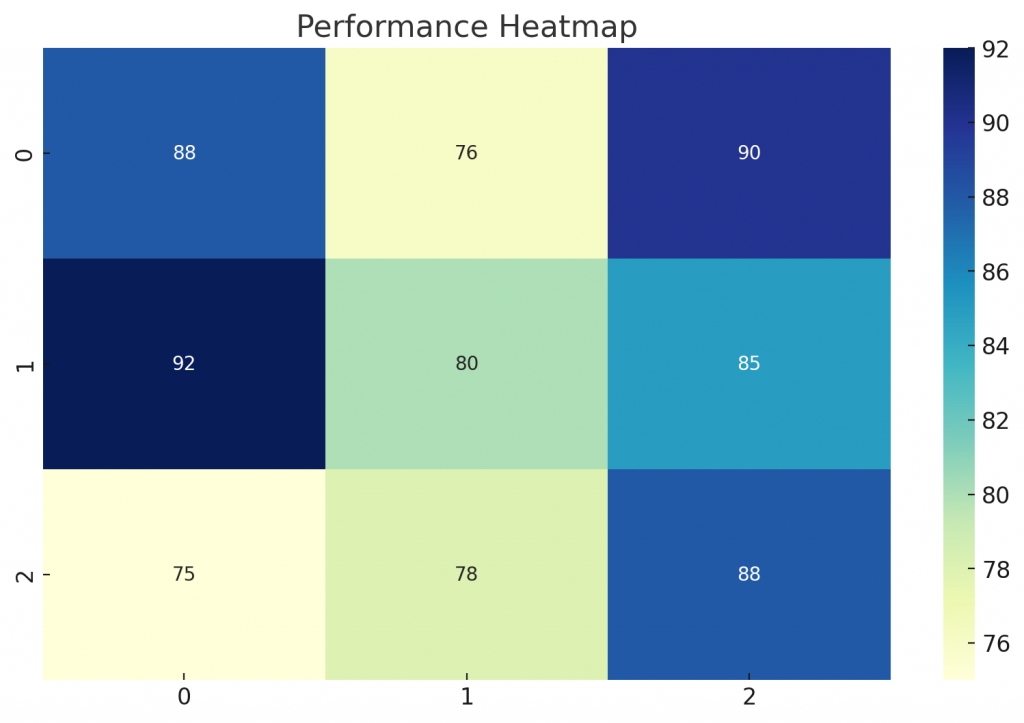
Seaborn builds on Matplotlib, giving us statistical charts and better visuals. It’s perfect for creating pair plots, heatmaps, and box plots.
Example Code (Heatmap):
import seaborn as sns

# Sample data for a heatmap

data = [

[88, 76, 90],

[92, 80, 85],

[75, 78, 88]

]

sns.heatmap(data, annot=True, cmap="YlGnBu")

plt.title("Performance Heatmap")

plt.show()
Output:

Real-Life Use Case Scenarios to Implement Python for Data Analysis
Now let us examine some practical cases when Python for data analysis is most useful.
Example 1: Customer Segmentation for Better Marketing Strategies
Consider a clothing store that wants to mail specific promotions to different consumer categories. Customer segmentation based on purchasing behaviour is the correct method.
Customers may be classified based on their previous purchases, spending patterns, and preferences using Python and the clustering algorithms in Scikit-Learn.
Code Example:
from sklearn.cluster import KMeans

import pandas as pd

# Sample customer data

data = {

'CustomerID': [1, 2, 3, 4, 5],

'Annual_Spend': [40000, 15000, 35000, 30000, 45000],

'Frequency': [4, 2, 3, 5, 4]

}

df = pd.DataFrame(data)

# KMeans clustering

kmeans = KMeans(n_clusters=2, n_init='auto')  # Adding 'n_init' parameter to avoid warning

df['Segment'] = kmeans.fit_predict(df[['Annual_Spend', 'Frequency']])

# Displaying the result with segments

df[['CustomerID', 'Segment']]
Output:
| CustomerID | Segment | |
| 0 | 1 | 1 |
| 1 | 2 | 0 |
| 2 | 3 | 1 |
| 3 | 4 | 1 |
| 4 | 5 | 1 |
Example 2: Price Optimisation for Maximising Sales
Using Python, we can analyse historical pricing and sales data to find the sweet spot.
How It Works:
- Load past pricing and sales data.
- Use regression models to find the best price points.
Code Example:
from sklearn.linear_model import LinearRegression

import numpy as np

# Sample data

prices = np.array([10, 15, 20, 25, 30]).reshape(-1, 1)

sales = np.array([500, 400, 350, 300, 250])

# Linear Regression

model = LinearRegression()

model.fit(prices, sales)

# Predict sales at a new price point

new_price = np.array([[22]])

predicted_sales = model.predict(new_price)

print("Predicted sales at $22:", predicted_sales[0])
Output:
Predicted sales at $22: 330.5
Example 3: Brand Sentiment Analysis on Social Media
Customer input is critical to the success of any brand. Social media sentiment analysis may reveal how people feel about a brand.
Python’s TextBlob library can quickly detect the emotion of messages or thoughts expressed in social media reviews.
Code Example:
from textblob import TextBlob

# Sample social media posts

posts = [

"I love the new collection at Zara!",

"The website crashed again. Frustrating experience.",

"Super happy with my purchase!"

]

# Sentiment Analysis

sentiments = [TextBlob(post).sentiment.polarity for post in posts]

print("Sentiment Scores:", sentiments)
Output:
Sentiment Scores: [0.34, -0.4, 0.67]
Example 4: Employee Retention Prediction
Losing employees costs a company time and money. With data, we can spot which employees might leave and take steps to retain them.
By analysing factors like job satisfaction and hours worked, Python helps us predict turnover using classification models.
Code Example:
from sklearn.tree import DecisionTreeClassifier

# Sample data for employee retention

data = {

'Satisfaction_Level': [0.8, 0.6, 0.3, 0.9, 0.2],

'Hours_Worked': [45, 50, 55, 40, 60],

'Left_Company': [0, 0, 1, 0, 1]

}

df = pd.DataFrame(data)

# Decision Tree Classifier

features = df[['Satisfaction_Level', 'Hours_Worked']]

target = df['Left_Company']

model = DecisionTreeClassifier()

model.fit(features, target)

# Predicting on new data

new_employee = [[0.5, 52]]

print("Will they leave?", model.predict(new_employee)[0])
Output:
Will they leave? 0
Example 5: E-commerce Trend Analysis
E-commerce businesses deal with massive datasets. Python helps analyse purchase patterns to predict high-demand periods.
With time-series analysis, we can forecast traffic, helping to prepare inventory and optimise marketing.
Also Read: Data Analyst Interview Questions with Answers
Code Example:
import pandas as pd

from statsmodels.tsa.holtwinters import ExponentialSmoothing

# Sample monthly sales data

sales_data = {

'Month': pd.date_range(start='1/1/2021', periods=12, freq='M'),

'Sales': [200, 220, 210, 250, 270, 300, 320, 310, 280, 340, 360, 380]

}

df = pd.DataFrame(sales_data)

# Forecasting sales

model = ExponentialSmoothing(df['Sales'], trend="add", seasonal="add", seasonal_periods=4)

forecast = model.fit().forecast(3)

print("Predicted Sales for Next 3 Months:", forecast)
Output:
Month 13: 370.00
Month 14: 406.67
Month 15: 416.67
Conclusion
Python for data analysis is more than a tool; it’s a whole system for turning raw data into actionable insights.
Real-world applications from customer segmentation to employee retention prove Python’s flexible application across industries.
Python makes data manipulation and complex calculation easy with friendly libraries like Pandas, NumPy, and Matplotlib. That said, with Python, data analysis isn’t just ‘doable’; it’s incredibly effective.
This being said, if your goal is to expand your skills further, then Hero Vired is offering an Advanced Certification Program in Data Science & Analytics. You will learn about the fundamental data analysis methods and necessary concepts to be prepared for the high-demand roles in this field.
Can a beginner start data analysis with Python?
How does Python compare to R for data analysis?
When using Python for data analysis, what are the biggest challenges?
Which libraries should I learn first for data analysis in Python?
Updated on November 6, 2024
