Linear regression is a popular and straightforward machine learning algorithm. This statistical method is useful for predictive analysis. What it does is makes predictions for numeric and continuous variables like age, sales, product price, salary, and more.
Before learning the ins and outs of linear regression, it is imperative to get an insight into the basics. Want to know about AI, ML, and data science? Click on this to learn about Data Science, Artificial Intelligence & Machine Learning course.
What is Linear Regression in Machine Learning?
Linear regression is an ML algorithm that showcases a linear relationship between y or dependent and one or y or another independent variable. Thus, it is best referred to as linear regression. It can find how the value of a dependent variable changes in accordance with the independent variable’s value.
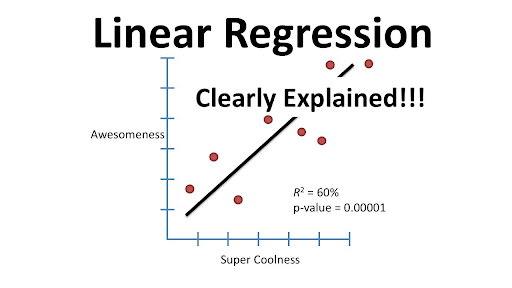
A linear regression model can offer a sloped straight line that represents the relationship between variables.

Learn the importance of linear regression in machine learning. But before that, here’s more about 14 Machine Learning in Healthcare Examples to Know.

Get curriculum highlights, career paths, industry insights and accelerate your data science journey.
Download brochure
Why is Linear Regression Machine Learning is important?
Establish a definite relationship between variables. The fact is that regression quantifies how the dependent variable changes as independent variables take different values.
Do you know what is Bagging vs. Boosting in Machine Learning?
Types of Linear Regression in Machine Learning and their Applications
Given below are the multiple types of linear regression in machine learning and their individual applications:
Simple Linear Regression
In linear regression in machine learning, the relationship between one independent variable or input and corresponding dependent variable (or output) is revealed. The formula is: y = β0 +β1x+ε
In this case, y is the output or dependent variable, while β1 and β0 are obscure constants.
Introducing Simple Linear Regression and how it works
In simple language, there are two things discovered via simple linear regression:
- The strength of the relationship between the variables
- The value of any dependent variable at a given value of an independent variable
Simple linear regression reveals the relationship between an independent variable and a dependent variable via a straight line.
How to implement Simple Linear Regression?
Want to know how simple linear regression in machine learning is implemented in the practical field? Learn the following pointers:
It is used to assess the marks secured by scholars depending on how many hours they have worked.
Predicts crop yields depending on the rainfall
Anticipating the salary of an individual depending on their experience
Want to know what is linear regression in machine learning? Learn more about Data Science and Machine Learning – How leaders can prepare for the future of business.
Multiple Linear Regression
MLR or multiple linear regression in machine learning determines the mathematical relationship amongst different random variables. It can examine how the independent variable is correlated to the dependent variable.
Introducing Multiple Linear Regression: Does it differ from Simple Linear Regression?
MLR considers the impact of more than a single explanatory variable on the outcome of interests. What it does is evaluates the relative effects of explanatory or independent variables on the dependent ones while holding other variables in a model constant.
The fact is that MLR differs from SLR. In simple linear regression, there’s one x and y variable. On the contrary, in multiple linear regression, there are one y and more than one x variables.
How to implement Multiple Linear Regression?
The best ways to implement multiple linear regression in machine learning have been mentioned below:
Obtains predicted values for specified variables under certain circumstances like levels of police confidence between sexes and at the same time controlling the influence of other parameters like ethnicity.
Evaluates the relationship between more than one independent variable and dependent variable (take the example of how temperature, rainfall, or fertilizers affect crop growth)
Helps assess the value of any dependent variable at the independent variables’ value (take the example of the expected crop yield of temperature, rainfall, and fertilizer)
Polynomial Regression
Polynomial regression is a technique used for predicting the outcome. It is the relationship between dependent and independent variables, where the dependent variable is connected to the independent variable with an nth degree.
But polynomial regression is different from linear regression in machine learning. Here, the dependent and independent variables should be linearly related.
How Polynomial Regression Can Capture Nonlinear Relationships in Data
Multiple organizations use Polynomial Regression to identify a nonlinear relationship between the dependent and independent variables. It is a tough regression technique when compared to other regression methods. Thus, one needs to have in-depth knowledge to achieve promising results.
How to Implement Polynomial Regression?
Polynomial regression is used in a wide assortment of experimental procedures that produce favorable outcomes:
- Used for studying the sediments’ isotopes
- Assesses the rise of diseases within a certain population
- Helps study the generation of any synthesis
Regularization Techniques – Ridge and Lasso Regression
Regularization is a comprehensive technique that makes certain improvements to learning algorithms. This improves the performance of models on unseen data. Ridge and Lasso Regression are the regularization techniques that prevent overfitting in a linear regression model. What it does is adds a penalty term to any loss function.
The ridge regression implements a similar constraint on coefficients. It introduces a penalty parameter. Although lasso regression takes the coefficients’ magnitude, ridge regression only takes the square.
How to Choose the Regularization Parameter and Interpret the Results of a Regularized Regression Model?
Regularization parameters can be selected through the following steps.”
- On a training set by estimating ridge regressions with multiple values of regularization parameter
- On a validation set, you can choose the best model (note that the regularized parameter must offer the lowest MSE on a validation set)
- On a test set, you need to check how much overfitting is done via the model selection on a validation set.
Evaluating Linear Regression Models in Machine Learning
The linear regression model in Machine Learning denotes the ultimate relationship between the dependent variable and more than one (or one) independent variable (y and x, respectively). The dependent variable happens to be the response variable, while the independent variables are explanatory/predictor variables.
Discuss Common Evaluation Metrics for Linear Regression Models
Here’s presenting the common evaluation metrics for any linear regression model:
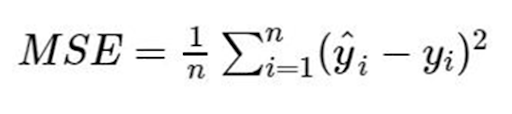
- Mean Square Error (MSE) or Root Mean Square Error (RMSE)R Square or Adjusted R Square
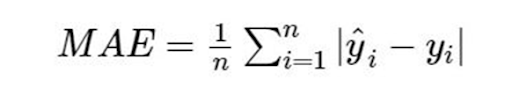
- Mean Absolute Error (MAE)

How to Calculate These Metrics in Python and Interpret Their Values?
How to Use Cross-Validation to Evaluate the Performance of a Linear Regression in Machine Learning Model?
Cross-validation is the model evaluation technique. Its central intuition behind the model evaluation helps figure out whether a trained model is generalizable (meaning, whether the predictive power observed while training is expected on the unseen data).
Conclusion
So, this post has compiled everything on linear regression in machine learning, its types, and applications. To give a deeper insight into the frequently asked questions, note down the given answers.
FAQs
To implement linear regression in Python, you need to note down these steps:
- Loading the Boston dataset first
- Check the dependent & independent variables
- Visualize changes in variables
- Divide data into dependent and independent variables
The package sci-kit-learn is available for this purpose.
Here are the common challenges arising while using linear regression in machine learning:
- Non-Linearity of response-predictor relationships
- Correlation of the error terms
- Error term’s non-constant variance
- Collinearity
- Outliers & High Leverage Points
To address these issues, you need to conduct research work, use simple models, including graphs, and seek residual plots.
Polynomial regression is a linear regression. Owing to the nonlinear relationship between independent and dependent variables, you add polynomial terms to the linear regression and convert it into the Polynomial regression. Here’s learning the most common cases for Polynomial regression:
- Studies of the sediments’ isotopes
- Evaluates the rise of diseases within a population
- Studies generation of synthesis
The output of Linear Regression in machine learning is a continuous value, integer, or probability percentage based on the selected problems. The output can be sales amount, profit percentage, probability of success or failure in some activities like admission possibility, winning an election, etc.