Data can be overwhelming. Ever had a huge amount of data but have no idea how to make sense of it? Having a mountain of unorganised data can scare most of us.
Clustering in data mining is a tool for breaking the data into smaller, more tractable aggregates. We make sense of all those thousands of rows by dividing them into groups of similar points. It’s rather akin to cleaning up a messy room by grouping similar things until everything adds up.
Think about this: A company with thousands of customers needs to tailor its services to different groups. How do they know which customers are similar? Clustering. By sorting people into groups based on their buying habits, the company can easily identify what each group wants and then modify its offers. The result? Everybody wins.
Data is not all numbers; it encompasses patterns, and with clustering, there is always a prospect of the revelation of unknown patterns that lead to better decisions.

What is Clustering in Data Mining
What Does It Really Stand for?
So, what’s clustering in data mining, actually?
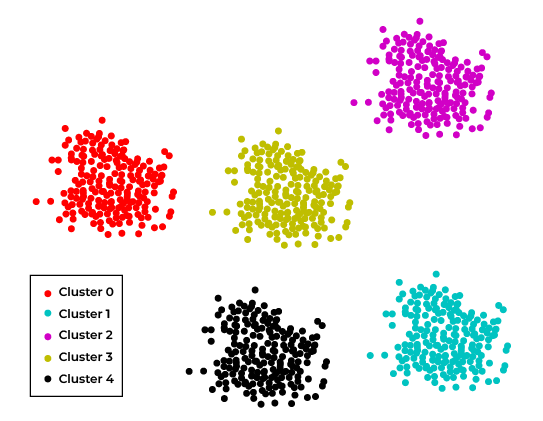
Clustering is the process of grouping a set of data points that are similar to each other. In other words, it means grouping together several data points that are alike. The whole idea is simple: group similar data points together so that they end up in one cluster and keep different points in different clusters. This helps us spot relationships within the data that won’t be obvious otherwise.
And this is the best part: it doesn’t need to know beforehand how the data should be grouped. In other words, clustering is an unsupervised method of learning since we let the data tell us what kind of patterns are there. It’s powerful since we don’t try to force the data into some preconceived categories- we just let the clusters form naturally.

Why is This Important?
Clustering allows us to:
- Find hidden patterns in large datasets
- Simplify data analysis by breaking it down into smaller, more manageable groups.
- Discover relationships between data points that wouldn’t be clear otherwise.
- Improve decision-making by identifying the key similarities between data points.
Let’s use an example where a supermarket will cluster its customers based on shopping patterns. It will put up special promotions targeting each group, which would lead to increased satisfaction among customers and, therefore, revenue.
Also Chek online professional certification : Business Analytics and Data Science

Get curriculum highlights, career paths, industry insights and accelerate your data science journey.
Download brochure
Important Features of Clusters of Data in Clustering
Now, when talking about clusters, there are a few things that are pretty important to remember. First of all, not all clusters are created equal, and certainly, some clusters are far more useful than others. Let’s break down what we consider to be a good cluster.
Features
High Intra-Cluster Similarity:
It means that points coming under the same cluster should be highly similar to each other. Let’s assume it is collecting things which definitely belong to the same group. If we are planning to cluster customers on the basis of their purchasing habits, it would be a good cluster if all the customers were purchasing similar things every month.
Low Inter-Cluster Similarity:
Clusters must be distinct. The points in one cluster must have very dissimilar points from those in another. If two clusters bear too much resemblance to each other, then they can be joined into one. We want clear demarcations between groups.
Scalability:
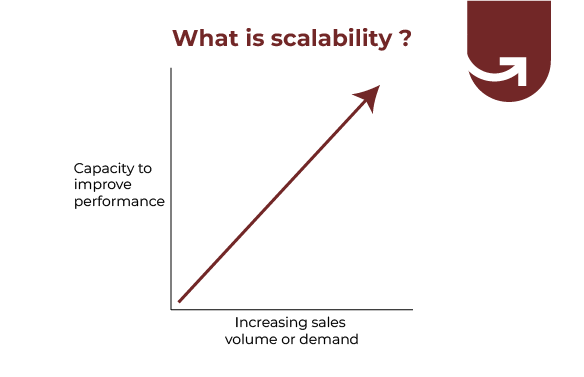
It should be able to handle large datasets without breaking a sweat. The more data that we can cluster, the more insights we can find. So, if we have millions of customers or billions of data points, clustering algorithms need to handle this efficiently.
Interpretability:
Clustering results should, therefore, be straightforward to interpret. Results that are either intuitively nonsensical or too complicated do not help you identify clear patterns. We thus require groups that can tell a story. That way, everyone- from analysts to decision-makers, can understand the output and behave accordingly.
Scalability:
Clusters can be of every shape and size. A good clustering algorithm should be able to identify clusters of sizes, shapes, and densities. Real-world data often makes a mess of itself; our clusters must, therefore, reflect this.

Example
Let’s take an example to make it more understandable: Assume that we are clustering customers for an online retail store. We’d probably be interested in creating clusters around the actual spending behaviour, one of which would consist of high-spending customers who frequently purchase costlier items, while another would consist of bargain hunters always looking for the lowest possible price.
By setting up these clusters, the store will be able to offer specific offers or discounts to each group based on their behaviour. Since the groups are unique and relatable, it will understand what each one really values.
In general, it is like a map created from a sea of data; clustering shows us the way to valuable insights. Whether we are trying to understand the customer’s behaviour, identify trends, or discover some hidden patterns, clustering helps us get there faster.
Also Read: Data Analyst Roles and Responsibilities
Most Commonly Used Clustering Algorithms in Data Mining
We often end up with a bunch of data, but how do we make sense out of that? Clustering algorithms help us collect items in groups that are like each other. However, the trick there is deciding which method to use. Each has its own different strengths, and if your choice makes or breaks your analysis, then the difference can speak for itself.
Let’s examine the most common clustering techniques so that we can see which one fits better in various scenarios.
K-Means: The Popular Partition-Based Method
K-Means is one of the programmers’ favourite algorithms. It’s easy and fast working.
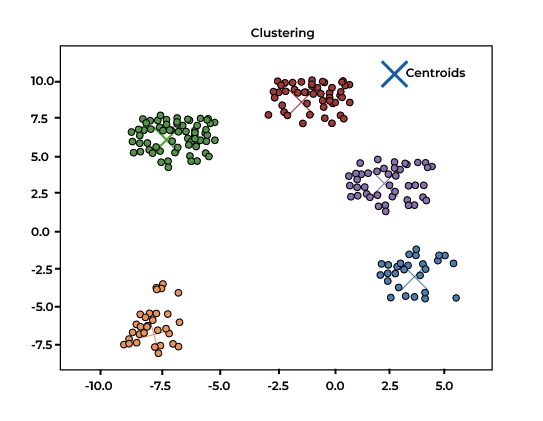
But precisely how does it do that? K-Means groups data by assigning each observation to the nearest centre (called a centroid) of one of the clusters. Then, having assigned all of the points, it calculates the centroid once more and repeats this until no further points are reassigned to other clusters.
It does well when you are thinking of several clusters, but it fails when clusters are not well-defined or clusters are unknown.
Example: Suppose we are a grocery store owner, and we like to segment our customers based on the kind of patterns they make for purchases at our store. K-Means facilitates dividing the customers into groups, such as people who spend money and penny pinchers, by identifying patterns in which they would make purchases.
Hierarchical Clustering: Agglomerative and Divisive Methods
Whereas K-Means divides the data initially, hierarchical clustering forms from the bottom up (agglomerative) or from the top down (divisive).
In an agglomerative model, each point starts as a cluster by itself; step by step, similar clusters merge. In the divisive method, we can start with one huge cluster that once again gets repeatedly split until a suitable number of clusters is reached.
Hierarchical clustering doesn’t need us to pre-specify the number of clusters. However, it gets very slow for large datasets simply because we are merging and splitting a lot.
Example: A bank may use hierarchical clustering to group customers based on their credit profile. Some clusters could contain low-risk customers, whereas others could be higher-risk. This would enable the bank to tailor its lending policies.
Density-Based Clustering: Handling Irregular Cluster Shapes
If you have data that doesn’t form a clean round cluster, DBSCAN might be your best choice. DBSCAN refers to Density-Based Spatial Clustering of Applications with Noise, one of the most popular algorithms in the class.
DBSCAN identifies clusters based on regions of density. One of the beauties of this method is that it can handle noise and discover clusters of some arbitrary shapes; you can relax and stop worrying about weird shapes getting mixed up.
Example: Imagine trying to understand the traffic patterns in a city. DBSCAN can assist in identifying which areas are more likely to get congested to make adjustments in the flow, independent of the shape and size of the roads, thereby better-assisting planners with where to focus.
Model-Based Clustering: Probabilistic Models for Data Analysis
Sometimes, the data will follow certain distributions, and we want to take that advantage. Model-based clustering assumes that each cluster follows a probability distribution (like Gaussian) and tries to estimate the parameters of these distributions in order to assign points to clusters.
This method is great for situations where data fits neatly into statistical models but can struggle if the data doesn’t fit these assumptions.
Example: In health care, doctors can use model-based clustering to group patients based on symptoms or test results, which follow a normal distribution. This will identify common disease patterns related to patients.
Fuzzy Clustering: Allowing Data Points to Belong to Multiple Clusters
Real-world data is messy. Often, data points don’t neatly belong to just one cluster. That’s where fuzzy clustering comes into play. Data points in fuzzy clustering can belong to more than one cluster but with different membership degrees.
Example: A music streaming service can apply fuzzy clustering to categorise users by their listening patterns. The one who mainly listens to classical may, from time to time, indulge in pop, and fuzzy clustering accounts for the overlap.
Real-World Applications of Clustering in Data Mining Across Multiple Industries
Clustering in data mining has real practical applications that cut across every part of our lives. From business to healthcare, grouping data capacity leads to smarter decisions and better results.
Marketing and Customer Segmentation
Marketing teams have one big question: “How do we make the right offer to the right person?”
Clustering answers to that. Grouping customers according to behaviour, interests, or spending habits allows marketers to offer targeted campaigns.

Example: Through clustering, a clothing retailer can know how often buyers come to their store, casual shoppers who sometimes come and go, and one-time customers. This can enable them to send similar, customised offers to each group. The frequent buyer can be offered access to a new collection before all others, for example. A one-time customer gets special discount offers.
Image Recognition and Image Processing Tasks
Clustering is not only applicable to numbers and customer data. It is widely used in the field of image processing, too.
Whether we try to group pixels according to their colour or find objects in an image, clustering helps us understand what exists in the picture. This is quite important in various fields, like satellite imagery or medical scans, where the detection of tiny differences may be vital.
Example: A medical setting could use a clustering algorithm to automatically separate types of tissue from an MRI scan in order to help doctors realise the cause of diseases more accurately.
Fraud Detection and Anomaly Identification
Fraud detection is critical in finance. But how can we possibly determine suspicious transactions if we have millions of data points?
Clustering helps to identify typical trends in data and, therefore, the easier-to-noticed changes within data.
A transaction that doesn’t fit in a developed cluster is automatically marked as a potential fraud.
Example: A bank applies clustering by categorising transactions in a specific pattern, such as location as well as spending patterns. When a transaction appears somewhere else from another country at a weird time of day, it is flagged for examination.
Text Mining and Document Categorisation
We live in an information world that creates tons of documents every second. But how do we make sense of it?
Clustering can be useful in grouping similar documents, making it easier to search, organise, and retrieve their information.
Example: A news website may employ clustering to classify news articles automatically, for example, into categories such as sports, politics, and entertainment. This makes it easier for users to find their favourite types of content.
Clustering Applied to Biological Data Analysis in Discovery Science
Clustering even does well with biological data. In fact, genetics researchers could use clustering when trying to classify genes or proteins that have similar behaviour or functions.
Example: For example, a scientist can group patients based on their gene-expression profiles in cancer research. This enables a scientist to find new subtypes of cancer that generally require more targeted treatments.
Addressing Key Requirements for Clustering: Scalability, Dimensionality, and Interpretability
The size and complexity of the data while dealing with clustering in data mining often create anxiety. How do we ensure our clustering is fine when our dataset is big, highly dimensioned, or hard to understand?
This is where three key aspects play their role: scalability, dimensionality, and interpretability.
Scalability: Handling Large Datasets Efficiently
A large set of data is highly common today. Still, most clustering algorithms do not scale well with a million or billions of data points.
How do we make sure that our algorithm scales smoothly?

Here are some tips:
- Choosing the right algorithm: Not all clustering algorithms handle big data well. K-Means works very efficiently on large datasets, but hierarchical clustering may run slower.
- Sampling: Sometimes, it’s far better to cluster the data using a smaller subset of the data. Once patterns are understood, one can apply the insights to the entire data.
- Parallel processing: If one or more machines or processors are available, this parallel processing accelerates the entire process by dividing the work across multiple processors or machines.
For instance, suppose we are a retailer trying to cluster millions of customer transactions. A scalable algorithm such as K-Means with parallel processing will get the job done fast but without loss of precision.
Dimensionality: Dealing with High-Dimensional Data
Data usually happens to have thousands of variables- or “dimensions”-and this can prove to be too much. Imagine, for example, genetics, where every sample may consist of thousands of measurements.
The more dimensions there are, the more confusing it becomes for the clustering algorithm, and the results worsen. The more data points we try to compare, the harder it becomes for the algorithm to spot meaningful clusters.
How do we address this problem?
- Dimensionality reduction: A technique such as PCA or t-SNE reduces the number of dimensions while ensuring that the important information is preserved and makes clustering easier and more accurate.
- Feature selection: We can select the most relevant variables instead of considering all of them. This reduces the noise and sharpens the clustering results.
For example, suppose we are interested in grouping customers based on their buying habits. Instead of including every detail about each purchase — the name of the coffee, the flavour of the cake, the size of the drink, which coffee machine was used, which sugar and syrup preferences, even which t-shirt was worn by the cashier? — It makes a lot more sense to include only the spending frequency and product category.
Interpretability: Making Results Understandable
Clustering results are only useful if we can understand them.
Suppose you’ve grouped your data into clusters, and now it’s time to explain that to your team. The results look like a mess. That’s a bad thing.
To make sure our results are well defined, we need:
- Well-defined clusters: We want clusters to stand out clearly. We can’t make much sense of the data if two clusters are too overlapped.
- Visualisation tools: Heatmaps, scatter plots, or dendrograms could enable a clearer depiction of the clusters to the naked eye, thus making it easier for all parties to interpret the key patterns.
The case of customer segmentation illustrates how the creation of simple charts to depict the clearly differentiated groups of customers would enable marketers to understand which group to target for a given campaign.
Managing High-Dimensional and Noisy Data in Clustering
Sometimes, our data isn’t only high-dimensional; it’s noisy, too. Noisy can be defined as missing data, mislabelled values, or outliers that don’t belong to the rest of the dataset.
Noisy data is important to handle. Without proper handling, it may break the clusters we may be able to find later.
Handling High-Dimensional Data
High-dimensional data is hard to cluster because, with more dimensions, it becomes more challenging for the algorithm to point towards meaningful patterns.
Here’s how to handle it:
- Reduce dimensionality before clustering: PCA or even auto-encoders can reduce the dimension of highly complex data without losing too much information.
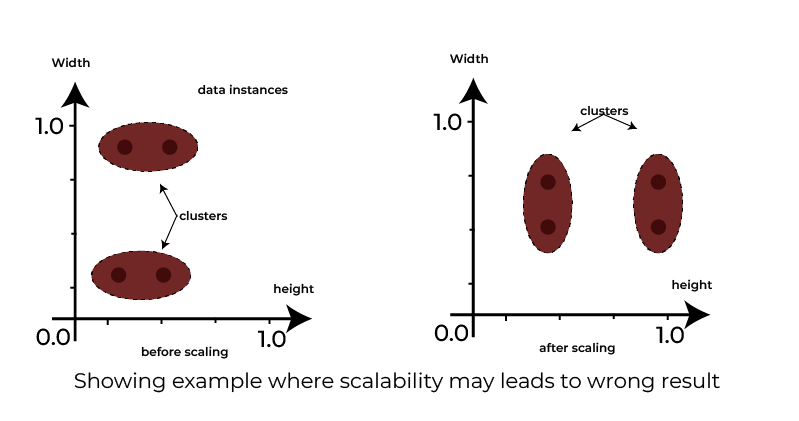
- Scale the data: This is essential when applying the clustering algorithm. Scale data so that it appears on a comparable scale. That avoids any particular feature dominating the clustering process. For instance, normalisation ensures that no particular feature dominates the clustering process.
Handle Noisy Data
Noisy data can come in any form—either some values are wrong or just outliers pulling the clusters in the wrong direction.
What’s the best approach to tackle this?
- Outlier detection: Make use of methods like DBSCAN that can identify and, therefore, ignore noise points while doing the clustering.
- Data cleaning: Before doing anything else with your clustering algorithm, clean the data. Remove or fix inconsistent values so that you are working with a relatively noise-free dataset, and the results are more valid.
Limitations and Challenges of Clustering Algorithms
Clustering isn’t perfect. As strong as it is, it has challenges that we need to go through.
Choosing the Right Number of Clusters
One major challenge lies in determining the number of clusters required by a particular algorithm. Most algorithms, including K-Means, require that we choose the number of clusters before running them. But what if we do not know?
Well, here’s how to make it easier:
- Elbow method: Plot the variance explained by the clusters. Elbow shall be the point where adding more clusters improves the variance very slightly. Thus, the “elbow” gives us an approximate number of clusters to use.
- Silhouette score: This methodology measures how similar each data point is with respect to their clusters versus other clusters. The higher the silhouette score, the better the data points are clustered.
For example, in a retail business, we might be interested in clustering customers into meaningful groups. Should there be 3 groups, 5 groups, 10 groups, or more? To answer this without guessing, we can use the elbow method.
Dealing with Overlapping Clusters
While dealing with clusters, some data points often end up fitting into more than one cluster. This is an issue with the K-Means algorithms, where it is assumed that the clusters are all distinct from each other.
To overcome this, we can:
Try fuzzy clustering: Algorithms using a degree of membership based on fuzziness allow a data point to belong to several clusters. This is a good option when the groups show some overlap.
Computational Complexity
This process may be slow, especially when dealing with large datasets or hierarchical clustering algorithms.
To avoid this:
- Use efficient algorithms: Methods that include K-Means and DBSCAN are faster in handling large data.
- Parallel processing: If we are dealing with a high number of data elements, splitting the work among multiple computers accelerates the process.
Imagine that we are dealing with real-time fraudulent transactions. We can’t provide such slow algorithms here. The faster algorithms allow us to get what we need in time.
Sensitivity to Initial Conditions
Some of the clustering algorithms, especially the derivatives of K-Means, have extreme sensitivity to how we choose the initial set of centroids for the clusters. A poor choice of the initial centroid will lead to the final results being the poorest possible quality.
It can be corrected in the following ways:
- Running the algorithm a few times: We try out various initial conditions, and then we pick the best output.
- Using smarter initialisation methods: Some algorithms improve the selection of the initial centroids, which generate better-quality clusters.
How Clustering Simplifies Data Summarisation and Interpretation
When you have a lot of data, it is very easy to lose track. Endless rows of numbers or variables may overwhelm you with how you feel about the general sense of the big picture.
That is where clustering in data mining comes to the rescue.
Clustering takes large datasets and organises them into smaller, more manageable groups, making analysis and interpretation much simpler to create.
Imagine we are looking at a customer database for a retail company. Contrary to the analysis of each individual customer, it categorises the groups into frequent buyers, occasional shoppers, and bargain hunters.
Now, instead of thousands of separate profiles, we are dealing with just a few meaningful segments. This summary of the data opens windows for us to:
- Understand behaviour patterns without going through every single point.
- Focus on larger groups and spot trends faster. Make quicker decisions since clusters provide clear insights.
- With clustering, we can take a dirty dataset and turn it into an organised summary, which is much easier to state or from which strategies are created.
Visualisation of Clusters for Better Insight
Data visualisation is yet another way in which clustering helps make the data simpler. By using graphs and charts, we can visualise every cluster for better pattern clarity.
For example, a scatter plot of customer expenditure behaviours with two clusters coloured in at once communicates how the different groups behave.
Clustering does not just make data easier to explain; it also makes it easier for others to understand.
Conclusion
Clustering in data mining allows us to break down complex datasets into smaller, more meaningful groups. Organising similar data points into clusters makes patterns and trends pop more out of these groups.
Whether it is customer data, financial transactions, or biological information, clustering makes analysis simpler and aids in more informed decision-making. It is an important means for pulling down practical sense from large, unstructured datasets, which should lead to simple actions.
From scaling to handling high-dimensional data, clustering remains a reliable approach for extracting value from the data, no matter the industry or complexity of the task at hand.
FAQs
Clustering and classification are both used to group data, but they are very different.
Clustering is an unsupervised method where we do not know the categories beforehand.
Classification, on the other hand, is supervised, where we already have predefined labels, and we are simply assigning new data to those labels.
One popular approach is the elbow method, where we graph the variance explained by each cluster and look for the point where adding more clusters doesn’t improve the variance much.
Another way is using the silhouette score, which measures how similar a data point is to its own cluster versus others.
Yes, some clustering algorithms, for example, DBSCAN, are developed with noisy data specifically in mind.
They are supposed to identify the noise and eliminate it to ensure that the clusters actually represent something. Of course, other algorithms will struggle with noisy data, and you should clean up the data or use a resistant clustering algorithm.
Fuzzy clustering is a good choice when your data points don't fit neatly into one cluster.
In K-Means, each point belongs to one cluster only, but in fuzzy clustering, a point can belong to several clusters with certain degrees of membership.
It is very useful for overlapping data groups
Clustering reduces large datasets into smaller, more manageable groups.
So, while we still have millions of individual data points, in practice, we often look at clusters, where each cluster actually represents a segment of the data. And that would simplify the analysis because we could really focus on the trends and patterns.
Updated on September 24, 2024


