
Data is everywhere, but making sense of it is a challenge. Businesses, researchers, and professionals all ask the same questions:
- How can we understand past trends?
- Why did something happen?
- What’s likely to happen next?
- How can we make the best decisions based on data?
These questions drive the need for data analysis. In this guide, we’ll break down types of data analysis, applications, and research methods in a way that is easy to understand and practical to use.
What is Data Analysis?
Data analysis is the collection, organisation, and interpretation of data to find patterns, relationships, or insights. It is used by businesses, governments, and researchers for problem-solving, improvement of efficiencies, and to assist in informed decision-making.
Data analysis is not merely about numbers. It’s about using information to better inform decision-making. Every industry depends upon it, from retail and finance to government policymaking.

POSTGRADUATE PROGRAM IN
Data Science & AIML
Learn Data Science, AI & ML to turn raw data into powerful, predictive insights.
What are the Different Types of Data Analysis?
Every dataset tells a story. Understanding the different types of data analysis in research helps extract valuable insights and make strategic decisions.
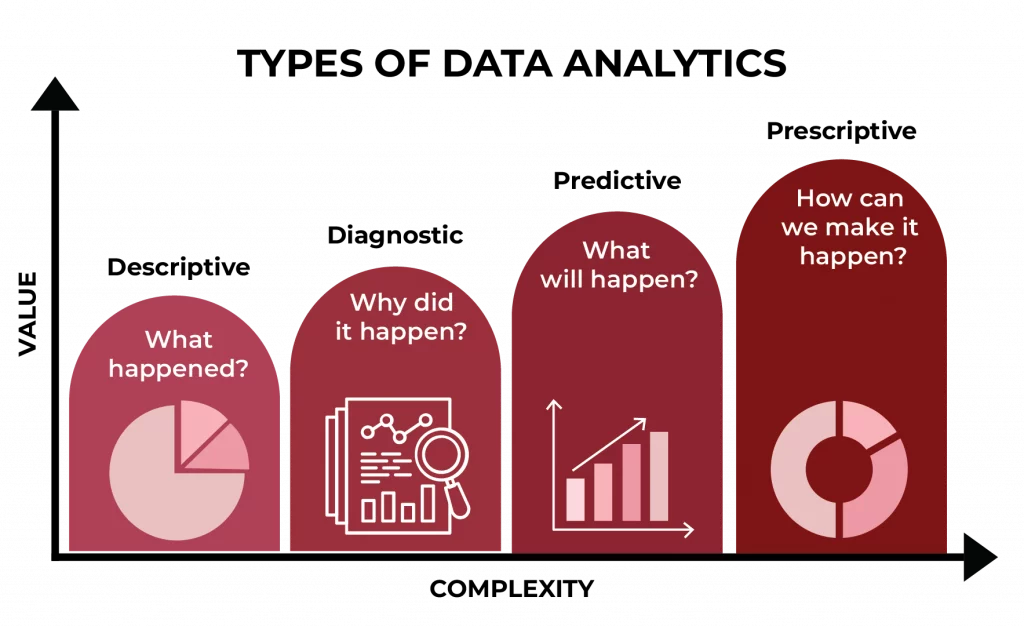
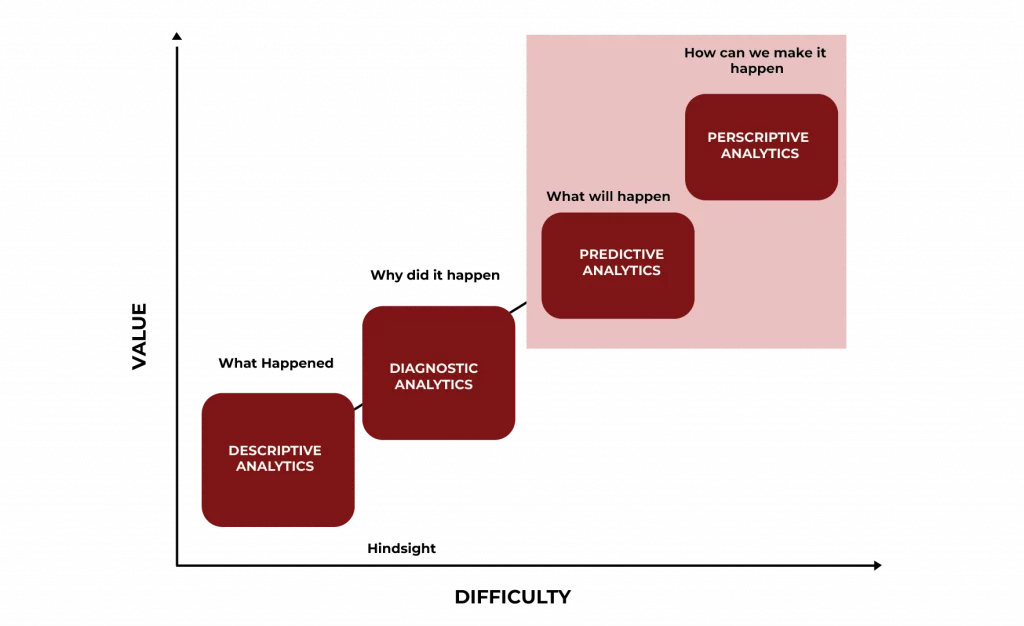
There are four main types of data analysis:
- Descriptive Analysis
- Diagnostic Analysis
- Predictive Analysis
- Prescriptive Analysis
Each plays a unique role in solving business problems, improving efficiency, and reducing risks.
1. Descriptive Analysis: Summarising Past Events and Trends
Descriptive analysis summarises historical data, detects patterns, and provides insights through tables, graphs, and statistical measures. Businesses use it to track sales performance, website traffic, and customer engagement.
Descriptive analysis is the foundation of all data analysis methods. It answers: What happened?
Techniques used:
- Data aggregation – Combines raw data into summaries.
- Data visualisation – Uses charts and graphs to highlight trends.
- Measures of central tendency – Calculates averages, medians, and modes.
Example:
- Google Analytics tracks website visits and bounce rates over time.
2. Diagnostic Analysis: Investigating Causes and Reasons Behind Outcomes
Diagnostic analysis takes descriptive data a step further. It answers: Why did it happen?
By comparing different factors, businesses identify the root cause of trends, anomalies, or unexpected outcomes. It is used in business performance analysis, healthcare research, and customer behaviour studies.
Techniques used:
- Drill-down analysis – Explores deeper layers of data.
- Correlation analysis – Measures relationships between variables.
- Anomaly detection – Identifies unusual patterns.
Example:
- Flipkart notices a drop in weekend sales and finds that a competitor launched a heavy discount campaign.
3. Predictive Analysis: Using Data to Forecast Future Trends and Probabilities
Predictive analysis uses historical data to make future predictions. It answers: What might happen next?
Businesses use it to anticipate customer behaviour, detect risks, and plan marketing strategies. It is used in stock market analysis, risk assessment, and customer retention strategies.
Techniques used:
- Regression analysis – Predicts relationships between variables.
- Machine learning models – Uses algorithms to identify patterns.
- Time series forecasting – Analyses trends over time.
Example:
- Netflix analyses past viewing habits to suggest what users will watch next.
4. Prescriptive Analysis: Recommending the Best Course of Action for Success
Prescriptive analysis takes predictive insights further. It answers: What should we do?
By using AI-driven recommendations, businesses optimise operations, automate decision-making, and improve efficiency. It is used in supply chain management, marketing automation, and personalised recommendations.
Techniques used:
- Optimisation models – Find the most efficient way to achieve goals.
- Recommendation engines – Suggest personalised actions.
- Simulation modelling – Tests different scenarios before making decisions.
Example:
- Google Maps suggests the best route based on real-time traffic.
Comparison of the Four Types of Data Analysis in Research
| Aspect | Descriptive Analysis | Diagnostic Analysis | Predictive Analysis | Prescriptive Analysis |
| Purpose | Summarises past data and trends. | Identifies reasons behind past events. | Forecasts future outcomes based on past patterns. | Recommends actions based on predictive insights. |
| Question Answered | What happened? | Why did it happen? | What might happen next? | What should be done? |
| Techniques Used | Data aggregation, charts, mean, median, and trend analysis. | Correlation analysis, anomaly detection, drill-down analysis. | Regression models, machine learning, time series forecasting. | AI-driven recommendations, optimisation models, and simulation testing. |
| Common Uses | Performance reports, sales trends, and web traffic analysis. | Identifying causes of declining sales, customer churn, or operational failures. | Demand forecasting, fraud detection, risk assessment. | Route optimisation, supply chain management, personalised marketing. |
The Data Analysis Process: Step-by-Step Breakdown
Breaking down data analysis into clear steps helps businesses and researchers extract meaningful insights.
- Data Collection
- Gather relevant data from multiple sources.
- Ensure data quality and integrity.
- Data Cleaning
- Identify and fix errors, missing values, and inconsistencies.
- Essential for accurate analysis.
- Exploratory Data Analysis (EDA)
- Analyse data characteristics, distributions, and relationships.
- Use visualisation techniques for better insights.
- Data Transformation
- Encode categorical variables and scale features.
- Handle outliers to prepare data for analysis.
- Model Building
- Apply suitable analysis methods like regression, clustering, or deep learning.
- Model Evaluation
- Assess model performance using metrics like Mean Absolute Error (MAE) or Root Mean Squared Error (RMSE).
- Interpretation and Visualisation
- Convert model results into actionable insights.
- Use tables, charts, and summary statistics to present findings.
- Deployment
- Implement insights into real-world applications and strategies.
- Ensure data-driven recommendations are effectively executed.

82.9%
of professionals don't believe their degree can help them get ahead at work.
Why is Data Analysis Important?
Informed Decision-Making
- Data analysis enables organisations to find their choices in statistical information instead of emotional responses.
- The organisation evaluates potential risks together with rewards to enhance marketing efforts as well as supply chains and new product launch initiatives.
Improved Understanding
- This approach generates knowledge about customers alongside market development patterns and organisational efficiency metrics.
- Enhances decision-making with data-backed knowledge.
Competitive Advantage
- Businesses identify market opportunities and threats through market trend analysis combined with competitor performance evaluation.
- By applying strategic adaptation, businesses can maintain leading positions against competitors.
Risk Mitigation
- Historical data analysis allows for detecting fraud together with identifying potential risks and abnormal behaviour patterns.
- Financial institutions achieve fraud prevention and safeguard their public image through this system.
Efficient Resource Allocation
- The system helps organisations achieve maximum budget efficiency together with optimal allocation of personnel and infrastructure.
- Hospitals can distribute their workforce alongside resources effectively through understanding patient requirement levels.
Continuous Improvement
- Performance metrics monitoring allows the organisation to improve processes and achieve higher efficiency.
- Supports an iterative approach for long-term business growth.
Usage of Data Analytics
Improved Decision-Making
- Uses data-driven insights to make informed choices.
- Increases success probability of decisions based on past outcomes.
- Eliminates uncertainty in implementing successful strategies.
Better Customer Service
- Uses churn modelling to identify reasons for customer attrition.
- Helps businesses adjust strategies to retain more customers.
- Improves overall customer satisfaction and loyalty.
Efficient Operations
- Identifies demand trends to streamline business processes.
- Optimises resource allocation for higher productivity.
- Reduces operational costs by eliminating inefficiencies.
Effective Marketing
- Uses market segmentation to target the right audience.
- Improves marketing strategies to increase sales and conversions.
- Helps businesses refine campaigns based on customer behaviour.
Different Types of Tools and Technologies Used in Data Analysis
Programming Languages
- Python – Widely used for data analysis and automation.
- R – Popular in statistical computing and research.
- SQL – Essential for managing structured databases.
Business Intelligence (BI) Tools
- Power BI – Visualises business data with interactive dashboards.
- Tableau – Converts raw data into meaningful reports.
- Google Data Studio – Helps analyse website and marketing performance.
Machine Learning & AI Platforms
- TensorFlow – Used for deep learning and neural networks.
- Scikit-learn – Provides machine learning algorithms for predictive analytics.
Applications of Data Analysis Across Different Industries
| Industry | How Data Analysis is Used | Example |
| Retail | Predicts demand and optimises stock levels. | Reliance Retail forecasts sales for festival seasons. |
| Healthcare | Identifies disease trends and improves patient care. | AIIMS analyses patient data to predict heart disease risks. |
| Finance | Detects fraud and assesses credit risk. | SBI detects suspicious transactions to prevent fraud. |
| Telecom | Reduces customer churn and improves service. | Jio predicts users are likely to switch networks. |
| E-commerce | Personalised product recommendations. | Flipkart suggests relevant products based on purchase history. |
Common Mistakes and Pitfalls in Data Analysis and How to Avoid Them
Data analysis mistakes result in incorrect findings which produce unnecessary wasting of resources alongside bad decision-making. The prevention of such common mistakes produces accurate and reliable insights.
- Confusing Correlation with Causation
- The fact that two variables share a connection does not demonstrate that one variable is related to the other.
- Example: The relationship between rising ice cream sales and drowning cases in summer does not indicate a causal connection between these two factors. Ice cream remains unrelated to drowning occurrences.
- Ignoring Data Cleaning
- Messy data leads to inaccurate results.
- Remove duplicates, errors, and irrelevant data before analysis.
- Overfitting Predictive Models
- A model that works perfectly on past data may fail on new data.
- Avoid by testing models on fresh datasets.
- Bias in Data Collection
- If the dataset is not diverse, the conclusions will be flawed.
- Example: A study on smartphone usage that only includes young users ignores older demographics.
- Relying Solely on Averages
- Averages can hide important variations.
- Use median and percentiles for a clearer picture.
Conclusion
Organisations use data analysis to transform basic information into valuable insights that lead to better decisions combined with operational optimisation and future trends forecasting. All organisations depend on diverse types of data analysis which enable them to track past performance results as well as make future predictions.
Organisations utilise descriptive and diagnostic techniques to identify patterns and factors behind them, as well as predictive and prescriptive methodologies to search for upcoming changes and suggest proper responses.
The correct data analysis methodology delivers clarity, accuracy, and strategic direction to businesses, which leads to better decisions along with improved results.
Acquiring expertise in data analysis demands both practical experience, correct training and hands-on work experience. The Advanced Certification Program in Data Science & Analytics delivered by Hero Vired prepares industry-ready professionals through their expert guidance and hands-on projects that focus on delivering real-world industry applications.
What are the types of data analysis in research?
- Descriptive analysis – Summarises past trends.
- Diagnostic analysis – Identifies reasons behind trends.
- Predictive analysis – Forecasts future trends.
- Prescriptive analysis – Recommends the best actions.
Is data analysis a good career choice?
How can beginners start learning data analysis?
Updated on February 21, 2025