
By pre-processing data with PCA, we inform machine learning algorithms what aspect of data is important to consider. It can take the most informative feature from large datasets and keep relevant information on the initial dataset. Adding a feature increases model complexity as model performance suffers for each newly added feature, commonly termed the ‘curse of dimensionality.’ Common issues with high-dimensional datasets, such as multicollinearity and overfitting, are also eliminated (or minimised) by projecting a high-dimensional dataset into a smaller feature space using PCA. When two or more independent variables are highly correlated, this situation is known as multicollinearity, which can present a problem for causal modelling. Models that overfit will generalise poorly to new data and will become useless.
PCA is a critical approach within regression analysis, but many other use cases range from pattern recognition image processing to signal processing. As with other variations for data PCA, such as principal component regression and kernel PCA, this article focuses on the most general version used in the current literature.
What is Principal Component Analysis (PCA)?
Generally, Principal Component Analysis (PCA) is an unsupervised machine learning technique designed to reduce the number of variables in a dataset while retaining most of its relevance. PCA enables dimensionality reduction and feature selection in that correlated features are mapped to independent components.
Using this method, the linear combinations of the original variables gave a complete picture of variance and covariance within the dataset. By looking at the scatter of data points, PCA allows one to tease out distribution-related characteristics to provide more insight into the underlying structure of the data.

POSTGRADUATE PROGRAM IN
Data Science & AIML
Learn Data Science, AI & ML to turn raw data into powerful, predictive insights.
Basic Terminologies of PCA in Machine Learning
Dimensionality
Dimensionality, or the number of features or variables in a dataset, is denoted by it. For example, a dataset of features, including height, weight, and age, would have three dimensions. You may find that visualisation and analysis in high dimensionality become complicated by the ‘curse of dimensionality’ (volume of space growing exponentially, making it harder to identify patterns). To do this, PCA reduces the number of dimensions while preserving important information.
Variance
Variance is a statistical measurement for determining how much the values of a single feature depart from its mean. The spread of data points in that feature is indicated. In PCA, variance is used to compute what features contribute the most to total variability in data. The higher variance of the features makes them prime candidates for the principal components as the higher variance features have more information in distinguishing between the data points.
Also Read: Different Types of Machine Learning
Covariance
Covariance is used to visualise how much two variables will vary together. It helps to determine whether increases in a certain feature or feature combination correspond to increases (positive covariance) or decreases (negative covariance) in another. A covariance of zero indicates independence between variables 1 and 2. For PCA, it is important to understand the covariance between features to derive directions of maximum variance and, thus, determine principal components.
Covariance Matrix
In a dataset, a covariance matrix is a square matrix with ellipsing of the features, which summarises the covariances between features in a dataset. The matrix is based on the covariance of two features, and the diagonal elements are the variance of each feature. This matrix is central to PCA because it’s basically how we relate the features and gives us, so to speak, the eigenvalues and eigenvectors that we need for dimensionality reduction.
Principal Component
PCA creates new axes, the principal components, representing the dataset’s maximum variance directions. Each principal component is a weighted sum of the original features arranged in an order that maximises variance, so the first is the one explaining the highest amount of variance, the second the next highest, etc. This transformation makes the dataset easily manageable and tries to retain its most important characteristics.
Eigenvalues
Eigenvalues denote the magnitude of each principal component’s variance. The higher the eigenvalue, the more the associated principal component explains the variance in the dataset. Eigenvalues are a key factor in determining the relevance of each principal component and the number of components that should be included in the analysis.
Eigenvectors
They indicate that the data varies the most in certain directions. Each eigenvector defines a new axis for the transformed dataset— called a principal component, and each principal component is associated with an eigenvector. PCA performs differently; eigenvectors are orthogonal to each other, so the principal components are independent and explain different variances in the data.
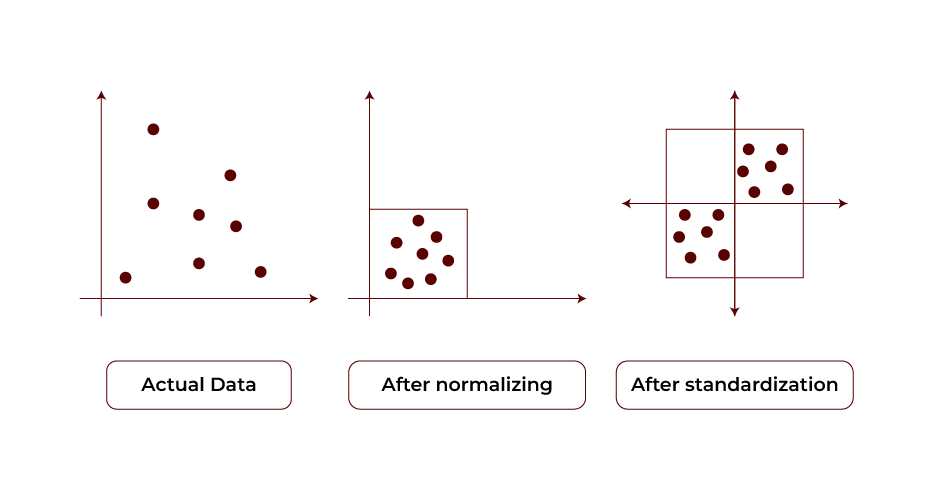
Standardization
The preprocessing step to standardise the dataset is to scale each feature to have a mean of 0 and a standard deviation of 1, called standardisation. This step is important before applying PCA; it must ensure features with larger ranges do not overly affect results. By standardizing the data, PCA can better rely on the structure of the underlying dataset.
Explained Variance
Better explained variance tells how much of the total variance of the dataset each principal component explains. It is usually expressed as a percentage of total variance. This metric determines how well the principal components explain the original data. Using explained variance, one can decide when the components are optimised for effective dimensionality reduction.
Also Read: Machine Learning Model
Calculating Principal Components
- Standardise the Data: The first thing to be performed while going through the PCA road trip is standardising the dataset such that each variable has a mean of 0 and a standard deviation of 1. This is a major step because PCA is very sensitive to this; standardising all features ensures that all features contribute equally to this analysis.
- Calculate the Covariance Matrix: Then, we standardise our data and calculate the covariance matrix on standardised data. This is a matrix of variables that relate to each other, showing how things ‘relate’ to everything in your dataset. It shows the relationships and dependencies between features.
- Calculate Eigenvectors and Eigenvalues: The eigenvectors and eigenvalues for the covariance matrix are found. Eigenvectors are the directions in which the data variance is maximum, and eigenvalues are the amount of variance in each of the corresponding eigenvectors.
- Choose the Principal Components: We select the principal components based on the eigenvectors corresponding to the highest eigenvalues. By applying these components, the data is compressed from a higher to a lower dimensional space, which captures the data’s most important fingerprint of variance.
- Transform the Data: This reduced-dimensional space is then created as defined by the chosen principal components, and the final step is transforming the original data into this space. The dataset is transformed to ease further analysis while retaining it.
Understanding Principal Components
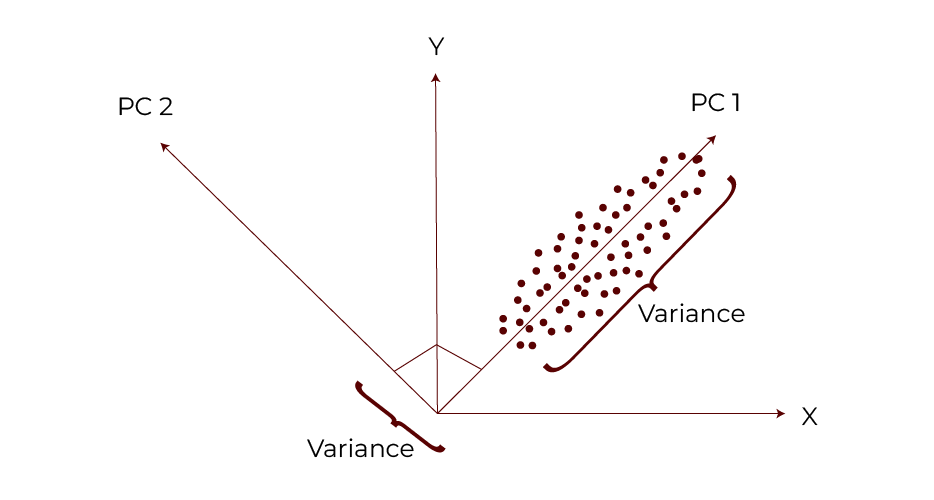
First Principal Component (PC1):
- The first component explains the greatest variance in the data. The axis that best represents the overall distribution of the dataset is known as it.
- The variance of PC1 is much higher than that of any other component.
Second Principal Component (PC2):
- The second principal component is an uncorrelated (orthogonal) component to PC1 that captures the next highest variance. This is another aspect of the data distribution.
- This means that the principal component should be independent.
Scatterplots of visualising PCA show the relationship between PC1 and PC2 as its perpendicular axes.
If more components are calculated, they follow the same properties. However, they are not correlated with each other, and any remaining variance in the data is removed.
Also Read: Data Science and Machine Learning

82.9%
of professionals don't believe their degree can help them get ahead at work.
Applications of PCA in Machine Learning
PCA for dimensionality reduction or feature extraction is ubiquitous in different areas. Common applications include:
- Image Compression is dimensionality-reducing data to help store and transfer the data efficiently.
- Bioinformatics: It analyses high dimensional gene expression data to find patterns and minimise the noise.
- Face Recognition: It extracts key facial features with improved speed and accuracy for recognition tasks.
- Recommendation Systems: It simplifies user-item interaction data to make the recommendation algorithms more efficient.
- Finance: It helps uncover the underlying trends and patterns within the financial datasets to aid in better decision-making.
PCA is a useful tool for easing and simplifying complex high-dimensional datasets, allowing us to get over the data more easily to see and analyse. PCA has a rich mathematical foundation and numerous applications and forms an essential tool for data scientists and analysts. PCA can be used in the real world only with its understanding.
Advantages of PCA
PCA offers several benefits for data analysis:
- Dimensionality Reduction: What PCA does is reduce the number of variables of a dataset by finding the most important ones. It enables us to analyse and visualise the data, where at first there were a lot of variables.
- Feature Extraction: PCA takes us from the original data to new features which will be easier and clearer. Here the initial features can be noisy and highly correlated, and this is helpful.
- Data Visualization: PCA uses the principal components to reduce high dimensional data down to 2 or 3 dimensions to look for patterns in the data, or clusters, that may not otherwise be seen.
- Noise Reduction: PCA allows the noise or errors to be repeated in the data, and thereby helps focus on the underlying patterns without the extra noise.
- Handling Multicollinearity: PCA can be used to identify the important variables which when in the dataset are highly correlated can reduce multicollinearity and greatly help in analysis.
Disadvantages of PCA
- Interpretability: There’s not an easy way to interpret the resulting principal components in terms of the original features. Nevertheless, principal component analysis (PCA) does successfully reduce dimensionality and find patterns.
- Information loss: The PCA reduces the dimensionality of the data to a subset of elements’ most important characteristics. This can eliminate or reduce noise, and reduce data, which may lose information if the selected components omit important features.
- Outliers: Principal components are known to be susceptible to anomalies in the data. The covariance matrix may be influenced by outliers which may then make it harder to identify the most important features.
- Scaling: Certain places where we might encounter that assumption will be broken using PCA. The resulting principal components will not correctly capture the underlying patterns if the data is not scaled appropriately.
- Computing complexity: The eigenvectors and eigenvalues of the covariance matrix could be costly to calculate for large datasets. PCA may then not be scalable, and could be not well suited for some applications.
Uses of PCA
Principal Component Analysis (PCA) is a versatile technique in data analysis with various applications, including:
- Data Compression: Then, PCA successfully decreases the dimensionality of high-dimensional data, making them more manageable for storage and analysis while preserving the gist of the information.
- Feature Extraction: PCA uses PCA to find the most significant features in a dataset. PCA can provide better predictive model performance by emphasising components that account for the most variance.
- Visualisation: PCA allows visualisation of complex and high-dimensional data in two or three dimensions. You can better understand and interpret the data patterns and relationships by simplifying the data.
- Data Pre-processing: PCA is very useful for preprocessing other machine learning algorithms, such as clustering and classification, by removing noise, thus improving the data quality for further analysis.
Implementing PCA in Python
import numpy as np

from sklearn.decomposition import PCA

from sklearn.preprocessing import StandardScaler

data = np.array([[2.0, 3.5, 4.5],

[5.0, 6.5, 8.5],

[9.0, 11.5, 12.5]])

scaler = StandardScaler()

data_std = scaler.fit_transform(data)

pca = PCA(n_components=2)

data_pca = pca.fit_transform(data_std)

components = pca.components_

explained_variance_ratio = pca.explained_variance_ratio_

print("Data:", data)

print("Standardised:", data_std)

print("Components:", components)

print("Variance Ratio:", explained_variance_ratio)

print("Reduced Data:", data_pca)
In this code, we apply Principal Component Analysis (PCA) to reduce a dataset’s dimensions:
- Data Preparation: In the code is the way it makes a simple dataset with three rows and three columns.
- Standardisation: Because values are made standardised (all values have mean 0 and standard deviation 1), PCA is more powerful.
- PCA Application: We create a PCA instance that tells us we want to reduce the data to 2 dimensions.
- Data Transformation: We use the PCA model to fit the standardised data and transform it to the new, reduced 2-dimensional space.
Conclusion
Principal component analysis (PCA), a popular unsupervised learning technique is often used to do dimensionality reduction. Now that you understand PCA and its application, hopefully, you’ve found this article useful. Any queries on PCA in Machine Learning? If yes, go through the Integrated Program in Data Science, Artificial Intelligence & Machine Learning in collaboration with Open Learning and get your hands-on practice on machine learning.
What is the essence of the machine learning Principal Component Analysis?
What is PCA used for?
What is PCA, LDA in machine learning?
What are the advantages of taking advantage of principal component analysis?
Updated on October 25, 2024