Data Visualization with Python

Unlock the power of data visualization with this course. It covers the fundamentals of data visualization, understanding statistical charts, creating and modifying charts using Python libraries. Equip yourself to effectively communicate complex data through impactful visualizations and enhance your analytical capabilities.
Duration
2 Hrs
Course level
Intermediate
Modules
12
Certificate
Included
circleStudents Enrolled : 2000+circle
Key Features of the course
Create visualizations with Python.
Understand statistical charts.
Modify and enhance plots.
Communicate data visually.
Use Python libraries.
What you`ll Learn

Introduction to Data Visualization

  • Importance of Data Visualization: Understand why data visualization is crucial for data analysis and communication.
  • Types of Visualizations: Learn about different types of visualizations and their applications.
  • Python for Data Visualization: Get introduced to the Python libraries commonly used for data visualization.
  • Statistical Chart Types: Learn about various statistical charts, including bar charts, line charts, histograms, and scatter plots.
  • When to Use Which Chart: Understand the scenarios and data types best suited for each statistical chart.
  • Reading and Interpreting Charts: Develop skills to read and interpret data from different types of statistical charts.
  • Python Libraries for Visualization: Get hands-on experience with Python libraries like Matplotlib, Seaborn, and Plotly.
  • Basic Chart Creation: Learn how to create basic charts using Python, including setting up your environment and writing code.
  • Customizing Charts: Understand how to customize charts by modifying colors, labels, and other visual elements.
  • Enhancing Visual Appeal: Learn techniques to enhance the visual appeal of your plots.
  • Interactive Visualizations: Get introduced to creating interactive visualizations using advanced Python libraries.
  • Advanced Plotting Techniques: Explore advanced plotting techniques to create complex and insightful visualizations.
  • Parameter Estimation Techniques: Discover various techniques for estimating the parameters of linear regression models.
  • Ordinary Least Squares (OLS): Learn how to use OLS for parameter estimation.
  • Maximum Likelihood Estimation (MLE): Get introduced to MLE for estimating model parameters.
  • Gradient Descent Algorithm: Understand the gradient descent algorithm and its importance in parameter estimation.
  • Implementation: Learn how to implement gradient descent for both linear and logistic regression models.
  • Convergence Criteria: Explore the criteria for convergence and how to ensure accurate parameter estimation.
  • Performance Metrics: Learn about various metrics for measuring the performance of regression models, including accuracy, precision, recall, and F1 score.
  • ROC and AUC: Understand Receiver Operating Characteristic (ROC) curves and Area Under the Curve (AUC) for evaluating model performance.
  • Cross-Validation: Discover the importance of cross-validation in assessing model performance and preventing overfitting.
  • Predictor Selection: Learn strategies for selecting the most relevant predictors for your regression models.
  • Regularization Techniques: Explore regularization techniques like Lasso and Ridge to control overfitting.
  • Model Complexity: Understand the trade-off between model complexity and performance, and how to achieve a balance.

Skills you’ll gain

Logistic Regression Fundamentals

Business Scenario Classification

Building Logistic Regression Models

Linear Regression Basics

Parameter Estimation Techniques

Gradient Descent for Parameter Estimation

Model Performance Measurement

Predictor Selection Strategies

Controlling Overfitting

Data-Driven Decision Making

Get certified

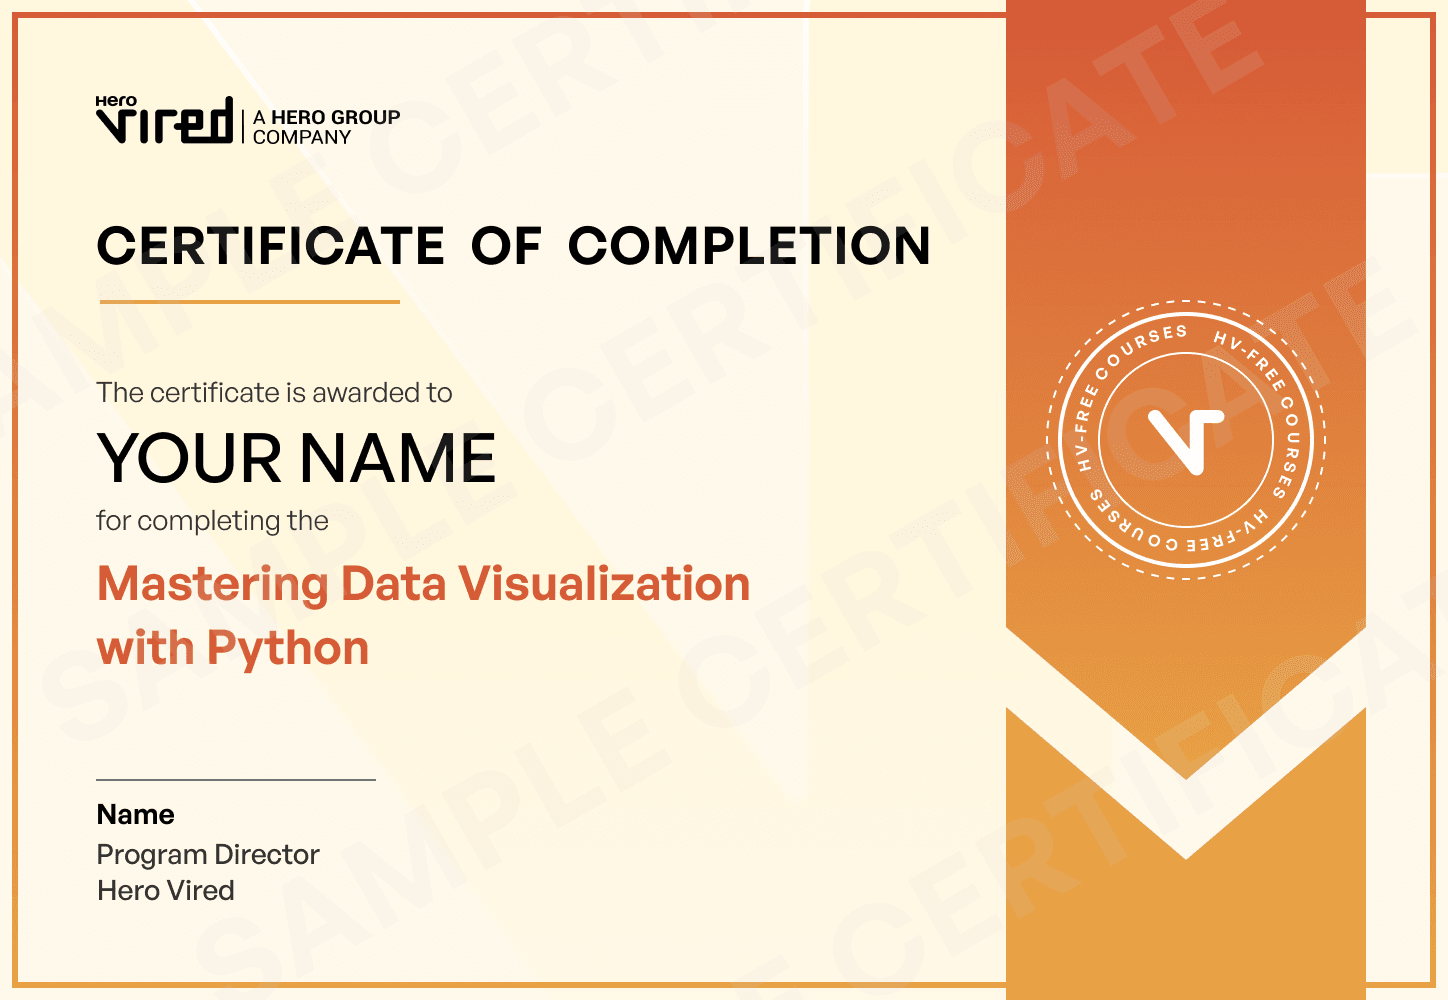
Upon successful completion of this course, you will receive a certificate from Hero Vired. This certificate, backed by Hero Group’s decades of research in Indian education, places you in an elite league of professionals. It validates your proficiency in both linear and logistic regression techniques, enhancing your career prospects and demonstrating your commitment to professional growth in data science and machine learning.

Hero Vired Certificate

Frequently Asked Questions

Is Python good for data visualisation?

Yes, Python is great with Data Visualization. It is packed with libraries like Matplotlib, Seaborn, and Plotly that aid you in creating a vast number of visualisations with ease. Be it simple line charts or difficult 3D plots, Python takes care of all your problems.

The salary range of an expert in Python data visualisation depends on a lot of factors: experience, location, and industry.

On average, professionals can expect a salary of 8.8 Lakhs to 18 lakhs on an annual basis. The senior roles or other positions that are much in demand might have even higher pay scales.

To master data visualisation using Python, one has to:

Learn basic programming in Python.

Explore libraries like Matplotlib, Seaborn, and Plotly.

Try your hand with real-world datasets.

Learn different types of visualisations and where to apply them.

Work on projects that test how much you're able to visualise, e.g., create really complex visualisations.

Keep learning new libraries and techniques.

View more

More courses curated for you
Basics of Python
Basics of Python
icon
5 Hrs. duration
icon
Beginner level
icon
9 Modules
icon
Certification included
avatar
1800+ Learners
View
Essentials of Excel
Essentials of Excel
icon
4 Hrs. duration
icon
Beginner level
icon
12 Modules
icon
Certification included
avatar
2200+ Learners
View
Basics of SQL
Basics of SQL
icon
12 Hrs. duration
icon
Beginner level
icon
12 Modules
icon
Certification included
avatar
2600+ Learners
View
next_arrow
left dot patternright dot pattern

Programs tailored for your success

Popular

IIT Courses

Management

Data Science

Finance

Technology

Future Tech

Upskill with expert articles

View all
Hero Vired logo
Hero Vired is a leading LearnTech company dedicated to offering cutting-edge programs in collaboration with top-tier global institutions. As part of the esteemed Hero Group, we are committed to revolutionizing the skill development landscape in India. Our programs, delivered by industry experts, are designed to empower professionals and students with the skills they need to thrive in today’s competitive job market.
Blogs
Reviews
Events
In the News
About Us
Contact us
Learning Hub
18003093939     ·     hello@herovired.com     ·    Whatsapp
Privacy policy and Terms of use

|

Sitemap

© 2024 Hero Vired. All rights reserved