
In the realm of computer science and programming, two fundamental concepts often come into play: algorithms and flowcharts. Both are very important as they are used to design, document, and solve different activities. Knowledge of these concepts is vital for anyone who is engaged in programming or wants to manage some process.
Algorithms and flowcharts help us understand problems and dissect them into workable solutions. While an algorithm provides a structured flow to solve a given problem, a flow chart provides a pictorial flow to it. Thus, understanding the difference between algorithm and flowchart below will help determine the advantages and usage scenarios of these two powerful tools.
Detailed Definition of an Algorithm
An algorithm is a versatile tool that can be used in a variety of scenarios. It refers to a well-defined procedure that is used in the process of solving a particular problem or in accomplishing a certain activity. The algorithms can be expressed in plain English, pseudocode, or in any language that can be compiled by a compiler, showcasing its adaptability and flexibility.
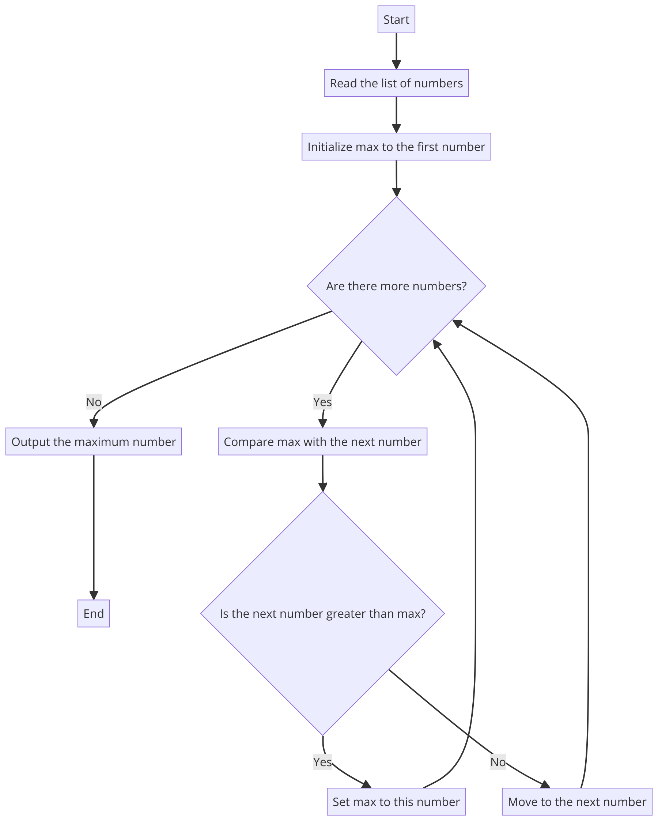
Here’s an example of a simple algorithm to find the maximum number in a list:
- Start with the first number in the list.
- Compare this number with the next number.
- If the next number is greater, it becomes the new maximum.
- Move to the next number and repeat the comparison.
- Continue until all numbers in the list have been compared.
- The last maximum found is the largest number in the list.
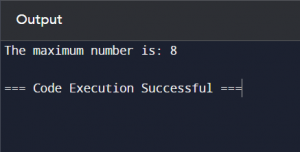
Example: Finding the Maximum Number in a List
Algorithm in Pseudocode:

| Parameter | Algorithm | Flowchart |
| Format | Text-based, written in natural language, pseudocode, or programming language | Graphical, uses symbols and arrows to depict steps |
| Usage | Used for developing software, performing calculations, automating tasks | Used for visualising processes, planning complex systems |
| Audience | Programmers, developers, technical users | Non-programmers, stakeholders, planning teams |
| Ease of Understanding | Requires familiarity with the language or pseudocode | Easier for visual learners, non-technical audiences |
| Error Identification | It is more challenging, especially for complex processes | Easier due to the visual nature |
Complexity of Understanding Algorithms Versus Flowcharts
Understanding algorithms can be challenging, especially for beginners. They require a good grasp of logical thinking and often involve complex concepts and notations. Writing and reading algorithms demand precision and attention to detail, which can be daunting.
Flowcharts, in contrast, are generally easier to understand due to their visual nature. By representing steps as symbols connected by arrows, flowcharts simplify the comprehension of processes. This visual approach helps identify the flow of actions and decisions more intuitively.
Example Comparison: Algorithm and Flowchart for Simple Addition
Algorithm:
- Start
- Read two numbers
- Add the numbers
- Display the result
- End
Flowchart:
- Start (Oval)
- Input: Read two numbers (Parallelogram)
- Process: Add the numbers (Rectangle)
- Output: Display the result (Parallelogram)
- End (Oval)

82.9%
of professionals don't believe their degree can help them get ahead at work.
Scope of Usage Across Different Domains
Flowcharts and algorithms are used across various fields, each serving unique purposes.
Flowcharts: Flowcharts find applications in:
- Business Processes: Mapping workflows and operational processes.
- Engineering: Designing and analysing systems.
- Education: Teaching and explaining concepts visually.
- Project Management: Planning and tracking project tasks.
Algorithms: Algorithms are predominantly used in:
- Computer Science: Writing programs and software.
- Mathematics: Solving mathematical problems.
- Data Analysis: Processing and analysing data.
- Artificial Intelligence: Developing AI models and solutions.
While algorithms are essential for technical fields, flowcharts have a broader application, making them useful in technical and non-technical domains.
Practical Applications and Use Cases for Algorithms and Flowcharts
Understanding the practical applications of algorithms and flowcharts helps choose the right tool for the task.
Flowcharts
Flowcharts are ideal for:
- Documenting Processes: Creating manuals or guides.
- Designing Systems: Planning software architecture.
- Problem-Solving: Visualising complex problems to find solutions.
- Training and Education: Explaining workflows and procedures to new team members.
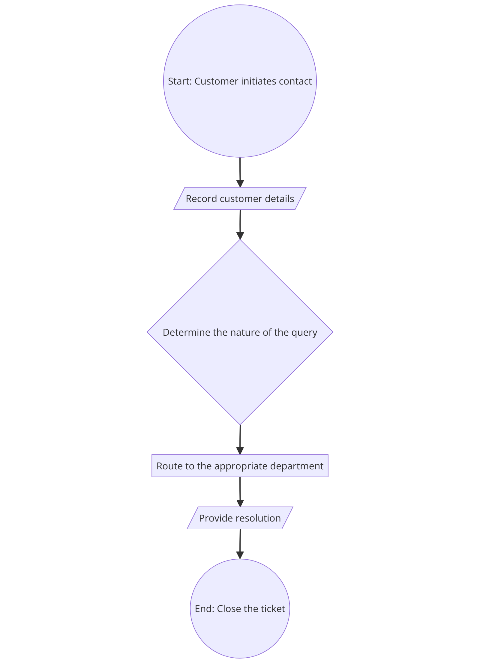
Example: Creating a flowchart for a customer support process:
Algorithms
Algorithms are essential for:
- Software Development: Writing code for applications.
- Data Processing: Sorting, searching, and analysing data.
- Automation: Developing automated workflows.
- Research and Development: Solving complex computational problems.
Example: Algorithm for sorting a list of numbers using Bubble Sort:
- Start: Initialise the list of numbers.
- Process: Compare adjacent numbers.
- Decision: Swap if necessary.
- Repeat: Continue until the list is sorted.
- End: Output the sorted list.
Python Code:
def bubble_sort(numbers):n = len(numbers)
for i in range(n):
for j in range(0, n-i-1):
if numbers[j] > numbers[j+1]:
numbers[j], numbers[j+1] = numbers[j+1], numbers[j]
return numbers
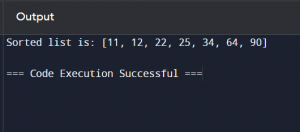
numbers = [64, 34, 25, 12, 22, 11, 90]
sorted_numbers = bubble_sort(numbers)
print(“Sorted list is:”, sorted_numbers)
Output:
User Requirements for Implementing Algorithms and Flowcharts
Understanding the user requirements for implementing algorithms and flowcharts is crucial.
Flowcharts:
- Accessibility: Can be created and understood without programming knowledge.
- Tools: Simple tools like pen and paper or software like Microsoft Visio and Lucidchart.
- Training: Basic understanding of the symbols and their meanings.
Algorithms:
- Technical Knowledge: Requires knowledge of programming languages or pseudocode.
- Tools: Integrated Development Environments (IDEs) like PyCharm and Visual Studio.
- Training: Proficiency in logic, syntax, and debugging techniques.
Debugging Process in Flowcharts Compared to Algorithms
Debugging is an essential aspect of process design and development.
Flowcharts:
- Visual Aid: The visual representation makes it easier to spot errors.
- Step-by-Step: Each step can be followed and checked individually.
- Collaborative: Easier for teams to collaborate and identify issues.
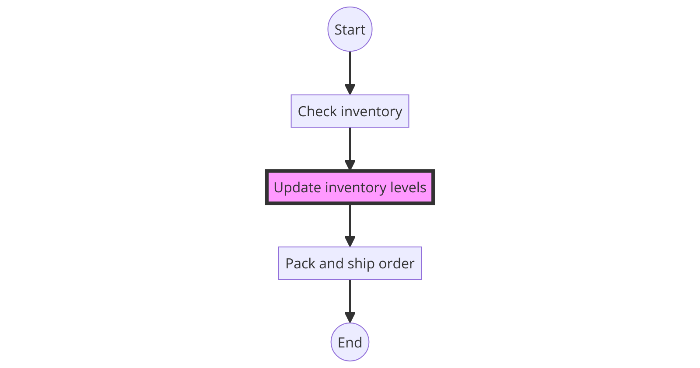
Example: Identifying a missing step in a process flowchart:
- Start: Customer places an order.
- Process: Check inventory.
- Missing Step: Update inventory levels.
- Process: Pack and ship order.
- End: Complete order.
Algorithms:
- Logical Flow: Errors can be harder to identify due to the linear, text-based nature.
- Complexity: Debugging complex algorithms requires in-depth knowledge and experience.
- Tools: Debuggers and IDEs assist in tracing and fixing errors.
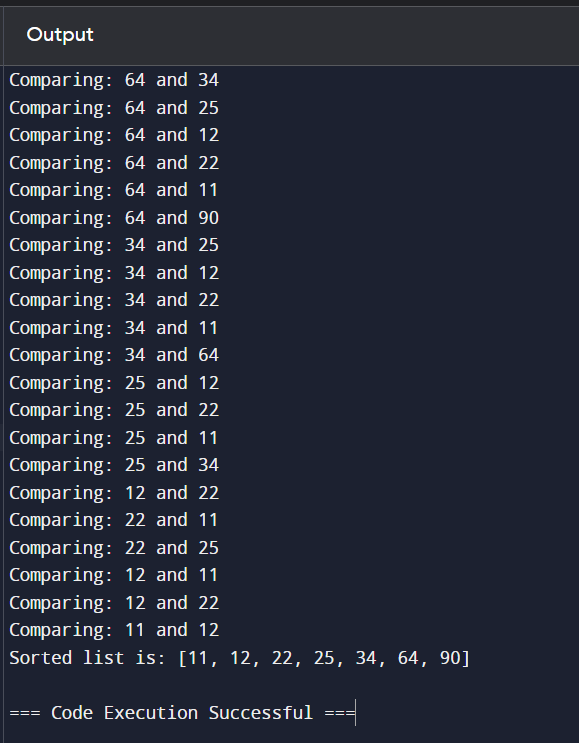
Example: Finding an error in a sorting algorithm:
- Error Identification: Incorrect sorting order.
- Step-by-Step Debugging: Use print statements to trace the sorting process.
- Correction: Adjust the comparison logic in the loop.
Python Debugging Example:
def bubble_sort(numbers):n = len(numbers)
for i in range(n):
for j in range(0, n-i-1):
print(f’Comparing: {numbers[j]} and {numbers[j+1]}’) # Debugging step
if numbers[j] > numbers[j+1]:
numbers[j], numbers[j+1] = numbers[j+1], numbers[j]
return numbers
numbers = [64, 34, 25, 12, 22, 11, 90]
sorted_numbers = bubble_sort(numbers)
print(“Sorted list is:”, sorted_numbers)
Output:
Implementation Rules and Standards for Flowcharts and Algorithms
Flowcharts and algorithms follow specific rules and standards to ensure clarity and consistency.
Flowcharts:
- Standard Symbols: Use standardised symbols like ovals, rectangles, diamonds, and parallelograms.
- Consistency: Maintain consistent use of symbols and arrows throughout the flowchart.
- Clarity: Ensure the flowchart is easy to read and understand.
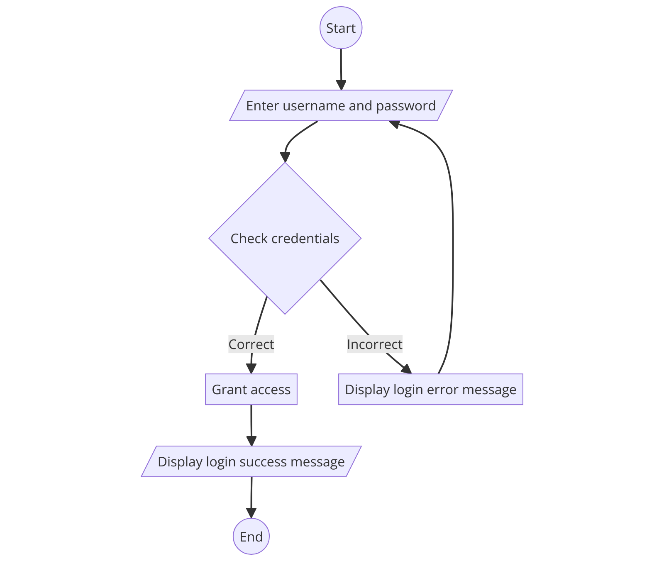
Example: Flowchart for a login process:
- Start: The user attempts to log in.
- Input: Enter username and password.
- Decision: Check credentials.
- Process: Grant access if credentials are correct.
- Output: Display login success message.
- End: Complete the login process.
Algorithms:
- Syntax Rules: Follow the syntax rules of the chosen programming language.
- Structure: Write clear, structured code with proper indentation.
- Comments: Use comments to explain the purpose of complex sections of the algorithm.
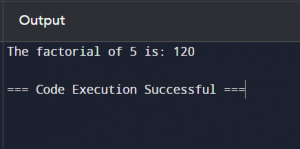
Example: Algorithm for calculating the factorial of a number:
- Start: Initialise the result to 1.
- Process: Multiply the result by each number up to the given number.
- End: Output the result.
Python Code:
def factorial(n):result = 1
for i in range(1, n + 1):
result *= i
return result
number = 5
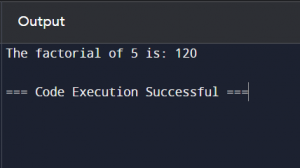
print(f’The factorial of {number} is:’, factorial(number))
Output:
These rules and standards help ensure that flowcharts and algorithms are effective tools for documenting, designing, and troubleshooting processes.
Representing Branching and Looping in Algorithms Versus Flowcharts
Representing branching and looping is crucial in programming and process design. These concepts allow for decision-making and repetition of actions, which are fundamental in both algorithms and flowcharts.
Branching in Algorithms
Conditional statements, which include if, else, if, and else, allow algorithms to branch and take different actions based on certain conditions.
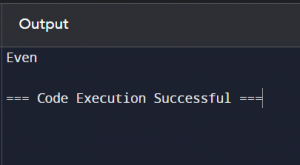
Example of Branching in Python:
def check_even_odd(number):if number % 2 == 0:
return “Even”
else:
return “Odd”
result = check_even_odd(4)
print(result)
Output:
Looping in Algorithms
Looping is used to repeat a set of instructions until a condition is met. Common looping constructs are for and while loops.
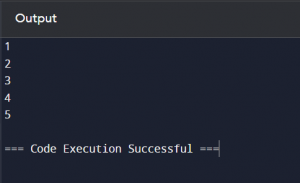
Example of Looping in Python:
def print_numbers(limit):for i in range(1, limit + 1):
print(i)
print_numbers(5)
Output:
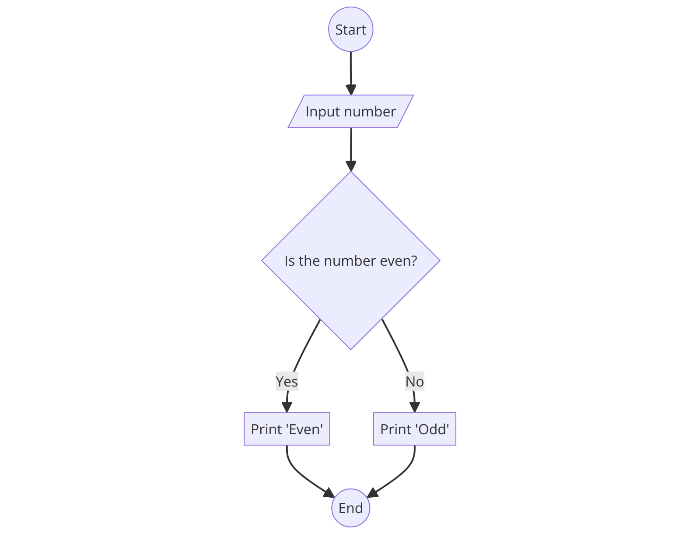
Branching in Flowcharts
Branching in flowcharts is represented by diamond-shaped decision nodes. Each branch corresponds to a possible outcome of the decision.
Flowchart Example:
- Start
- Input number
- Is the number even?
- If yes, print “Even”
- If no, print “Odd”
- End
Flowchart Diagram:
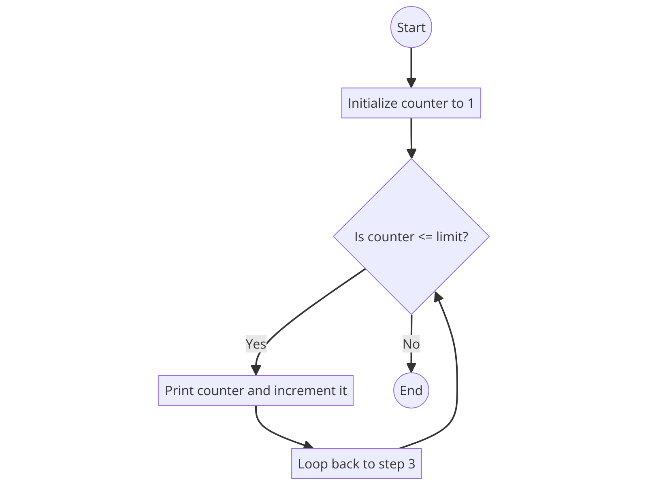
Looping in Flowcharts
Looping in flowcharts involves arrows looping back to previous steps, indicating repetition.
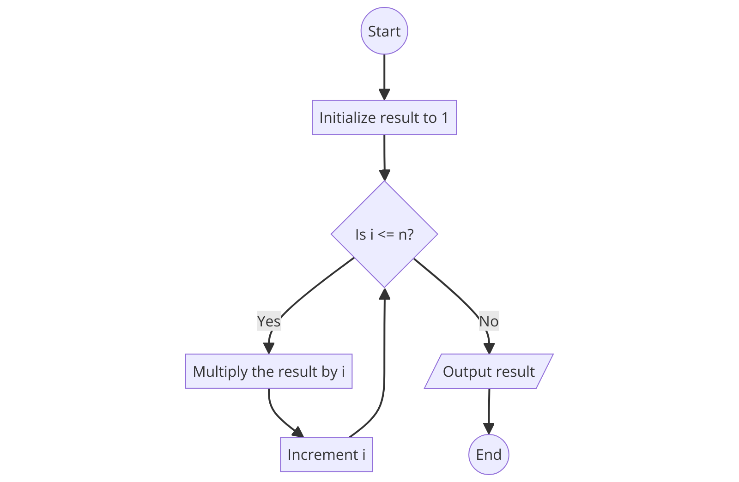
Flowchart Example:
- Start
- Initialise counter to 1
- Is counter <= limit?
- If yes, print the counter and increment it
- Loop back to step 3
- If no, end
Flowchart Diagram:
Solutions Representation: Graphical Format in Flowcharts vs. Text in Algorithms
When it comes to representing solutions, there is a difference between algorithm and flowchart approaches.
Algorithms: Textual Representation
Algorithms use a linear, textual format. This approach is detailed and precise, suitable for execution by a computer.
Example of Factorial Calculation:
def factorial(n):result = 1
for i in range(1, n + 1):
result *= i
return result
number = 5
print(f’The factorial of {number} is:’, factorial(number))
Output:
Flowcharts: Graphical Representation
Flowcharts use symbols and arrows to represent each step visually. This makes them easier to follow, especially for complex processes.
Flowchart Example for Factorial Calculation:
Advantages and Disadvantages of Using Algorithms
Advantages
- Precision: Algorithms provide clear and detailed steps.
- Automation: Easily translated into code for automation.
- Efficiency: Optimise solutions for complex problems.
Disadvantages
- Complexity: Can be difficult to understand for beginners.
- Time-Consuming: Writing detailed algorithms can be time-intensive.
- Flexibility: Limited by the structure and language used.
Advantages and Disadvantages of Using Flowcharts
Advantages
- Clarity: Easy to understand and follow.
- Visual Appeal: Helps in visualising processes.
- Communication: Useful for explaining processes to non-technical users.
Disadvantages
- Complexity: Large flowcharts can become cumbersome.
- Modification: Difficult to update once created.
- Standardisation: Lack of standard symbols can lead to confusion.
Conclusion
It will be very difficult to manage a program or process without using algorithms and flowcharts within the programming process. The algorithms provide precise step-by-step procedures for solving problems that are written in plain text or pseudocode. They are best when it comes to accuracy and speed; for that matter, they are perfect when it comes to handling complicated numbers and other computations to be automated. Flowcharts are more comprehensible graphic symbols for the processes, which makes it easier, especially for non-technical users. They are useful for explaining processes, detailing tasks, and defining methods of problem-solving.
Through our exploration of the difference between algorithm and flowchart, we learned how each tool handles branching and looping, the distinct advantages of its formats, and the practical applications it offers. By understanding both, we can leverage their strengths to design more efficient, clear, and understandable processes. This dual approach enhances our ability to communicate ideas and implement solutions effectively in various domains.
What is the main difference between an algorithm and a flowchart?
Why are flowcharts considered easier to understand than algorithms?
Can flowcharts be used without programming knowledge?
How do flowcharts help in debugging compared to algorithms?
Are there any standardised rules for creating flowcharts?
Updated on July 8, 2024